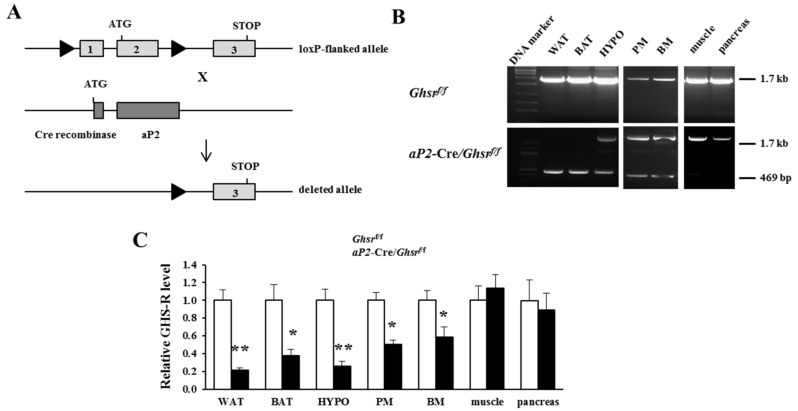
Figure 1.
Generation and validation of aP2-Cre/Ghsrf/f mice. (A) Schematic diagram of generation of aP2-Cre/Ghsrf/f mice: GHS-R floxed mice were bred with aP2-Cre mice to generate aP2-Cre/Ghsrf/f mice; (B) polymerase chain reaction (PCR) analysis of genomic DNA isolated from white adipose tissue (WAT), brown adipose tissue (BAT), hypothalamus (HYPO), peritoneal macrophages (PM), bone marrow (BM), skeletal muscle, and pancreas. The 1.7-kb PCR-amplified band indicates the amplification of the GHS-R floxed allele, and the 469 bp PCR-amplified band indicates the deleted GHS-R allele. The 469 bp band was present in WAT, BAT, hypothalamus, PM and BM, but absent in skeletal muscle or pancreas; (C) Ghsr mRNA expression levels in WAT, BAT, hypothalamus, PM, BM, skeletal muscle and pancreas. Ghsr expression was decreased in WAT, BAT, HYPO, PM and BM, but not in other tissues. n = 5–9, in each group. * p < 0.05, ** p < 0.001, Ghsrf/f vs. aP2-Cre/Ghsrf/f. The results were represented as mean ± standard error of the mean (S.E.M.). The two-tailed Student’s t-test was used for statistical analysis.

