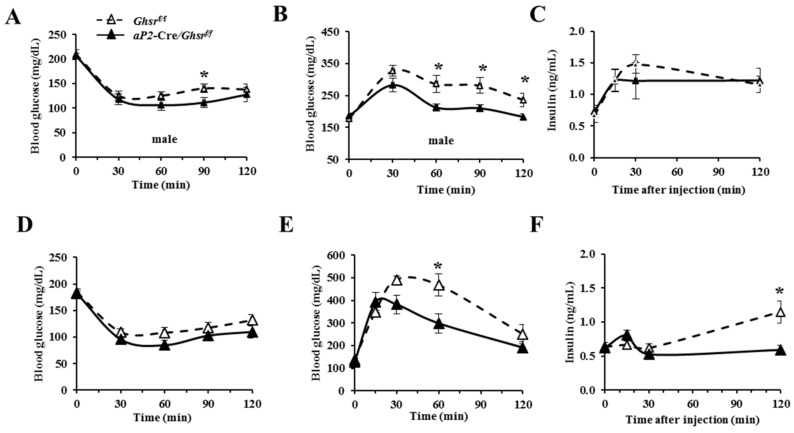
Figure 4.
Glycemic profiles of young and old aP2-Cre/Ghsrf/f mice. (A) Blood glucose during insulin tolerance tests (ITT), and blood glucose (B) and insulin (C) during glucose tolerance tests (GTT) of 5–6 months-old young male Ghsrf/f and aP2-Cre/Ghsrf/f mice; (D) blood glucose during ITT, and blood glucose (E) and insulin (F) during GTT of 15–17 months-old male Ghsrf/f and aP2-Cre/Ghsrf/f mice. n = 7. * p < 0.05, Ghsrf/f vs. aP2-Cre/Ghsrf/f. The results were represented as mean ± S.E.M. Repeated measurement-ANOVA was used for statistical analysis.

