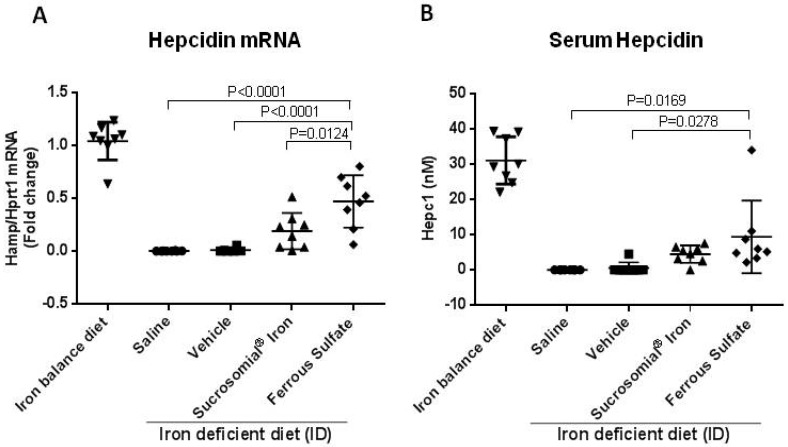
Figure 4.
Treatment effect on liver hepcidin mRNA and serum hepcidin. (A) qPCR for hepcidin normalized for HPRT1; and (B) serum hepcidin by mass spectrometry. Analysis by qPCR were performed on samples derived from liver of healthy untreated mice on an iron balanced diet (IB) and mice on iron deficient diet (ID) treated with Saline, Vehicle, Sucrosomial® Iron and Ferrous Sulfate (1 mg/kg) by gavage for two weeks. In (A) and (B) Saline (circles), Vehicle (squares), Sucrosomial® Iron (triangles), Ferrous Sulfate (diamonds) and iron balance group (inverted triangles). p values were obtained by one-way ANOVA.

