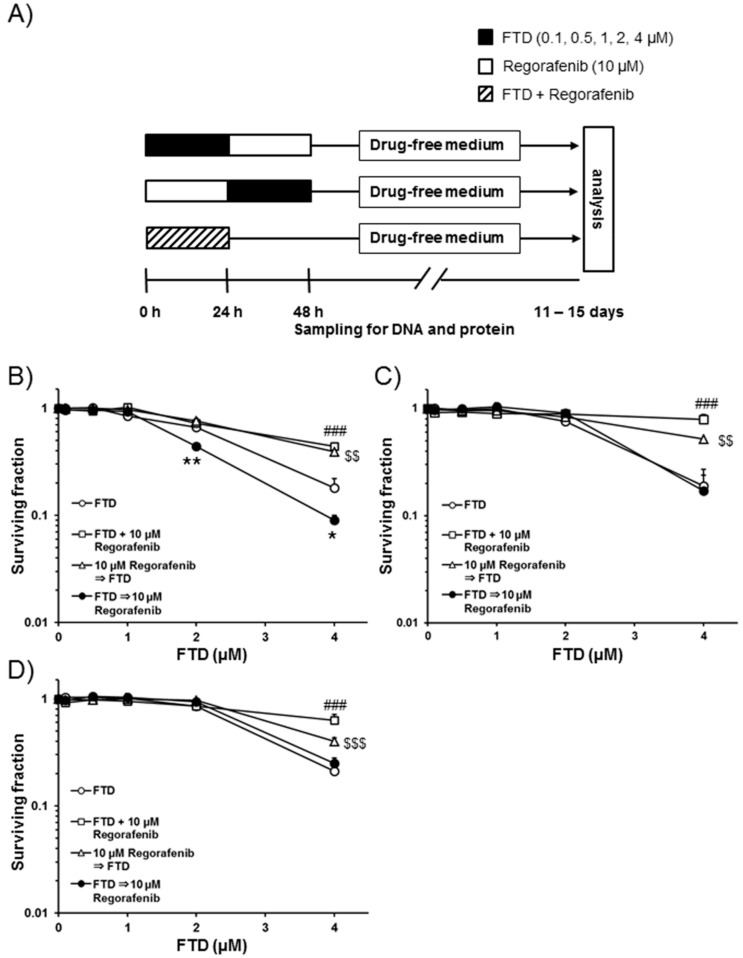
Figure 1.
A clonogenic cell survival assay of trifluridine (FTD) and regorafenib using various treatment schedules in SW620, HCT 116, and HT-29 cells. (A) Treatment schedules are shown. Cells were plated at appropriate concentrations in duplicate in six-well plates. SW620 (B), HCT 116 (C), and HT-29 (D) cells were exposed to 0.1–4.0 µM FTD alone, in combination with 0.1–4.0 µM FTD and 10.0 µM regorafenib for 24 h, 0.1–4.0 µM FTD for 24 h followed by 10.0 µM regorafenib for 24 h, or 10.0 µM regorafenib for 24 h followed by 0.1–4.0 µM FTD for 24 h. Eleven to fifteen days after removal of the drug, the number of colonies was determined. Data from three independent experiments are presented as the mean + standard deviation (SD); surviving fraction (SF) in 0.1–4.0 µM FTD followed by 10.0 µM regorafenib or regorafenib followed by FTD was calculated by assuming a SF of 1.0 when cells were treated with 10.0 µM regorafenib alone for 24 h. Mean SF values for the sequential combination of 2.0 or 4.0 µM FTD followed by 10.0 µM regorafenib in SW620 cells are shown. * p < 0.05 and ** p < 0.01 represent significant differences compared with 2.0 or 4.0 µM FTD alone. ### p < 0.001, $$ p < 0.01, and $$$ p < 0.001 represent significant differences compared with 4.0 µM FTD alone.

