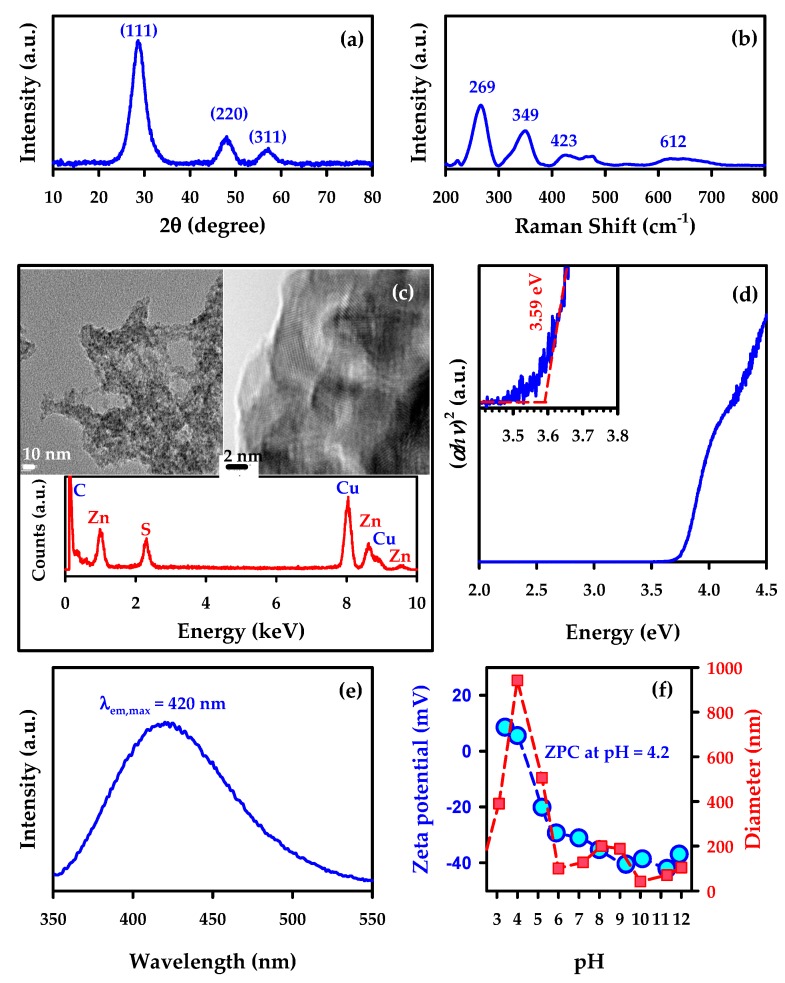
Figure 2.
Example for the characterization of a ZnS model semiconductor. Further experimental details about the synthesis of ZnS, data collection, and interpretation can be found in references [2,9]. (a) Powder X-ray diffractogram (XRD) for cubic ZnS. (b) Raman spectrum for cubic ZnS. (c) Transmission electron microscopy (TEM) of ZnS with energy-dispersive X-ray spectroscopy (EDS), showing that the 1:1 stoichiometric ratio of Zn:S is maintained on the surface. (d) Tauc plot obtained by plotting the square of the product of the absorption coefficient (proportional to the Kubelka–Munk function recorded by DRUVS) and energy in eV vs energy. A linear extrapolation provides the bandgap of 3.59 eV (or λ = 345 nm) for colloidal ZnS suspended in water. (e) Photoluminescence spectrum of colloidal ZnS suspended in water and excited at λ = 300 nm with an emission maximum at λem,max = 420 nm. (f) Dynamic light scattering (DLS) analysis of colloidal ZnS suspended in water showing the (blue circle) zeta-potential and (red square) particle size (diameter from the unimodal distribution) at variable pH with a zero point of charge (ZPC) at pH = 4.2.

