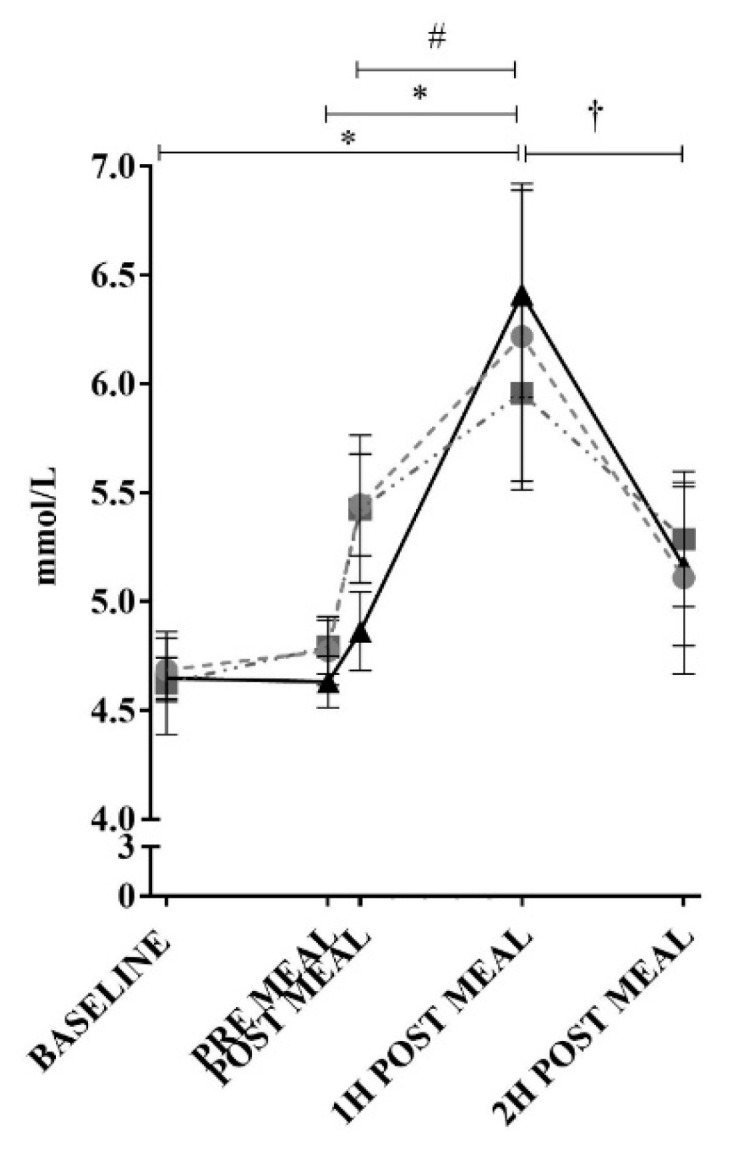
Figure 4.

Blood glucose responses to ingestion of test meals. ● = control meal, ■ = high-OA, ▲ = high-LA. Measured in plasma using an auto-calibrating automated sampler. * = p < 0.05 all meals comparing time points. † = p < 0.05 for control and high-LA comparing time points. # = p < 0.05 for high-LA comparing time points. All data shown as mean ± SEM, all data points n = 8 (average of triplicates).
