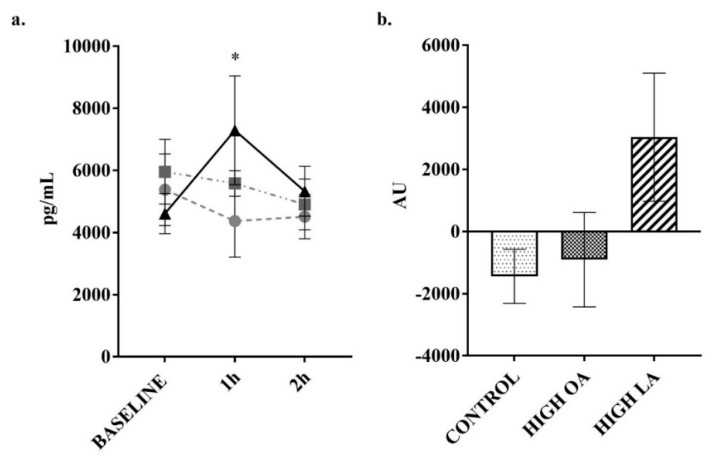
Figure 8.
Change in resistin over 2 h postprandial period. (a) plotted values, ● = control meal, ■ = high-OA, ▲ = high-LA; (b) Net AUC from baseline. Measured in plasma using a multiplex immunoassay. All data displayed as mean ± SEM, all data points n = 8. *, significantly different (p < 0.05) at this time point compared to baseline for the LA meal.

