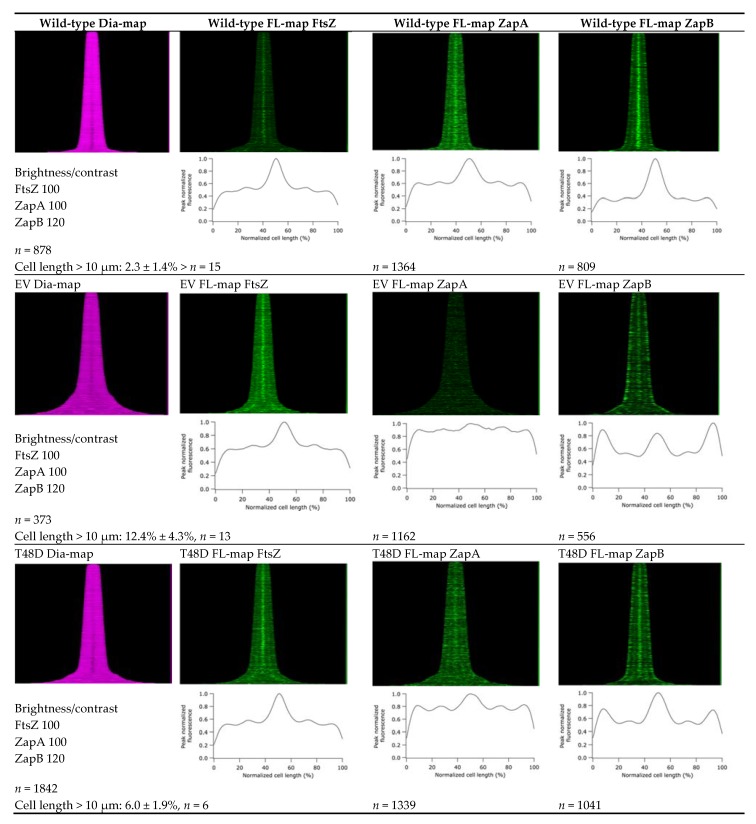
Figure 5.
Map of diameter and map of fluorescence profiles and average fluorescence profile of FtsZ, ZapA, and ZapB of TB28∆zapA [10] expressing ZapA mutants from plasmid. The cells were grown exponentially in rich medium at 37 °C and the OD600 was kept below 0.3. Expression of the mutants was induced with 50 µM IPTG for six mass doublings. Cells were fixed and immunolabeled as described in the experimental procedures. Of each sample, from left to right the map of diameter of the FtsZ-labeled sample, the map of fluorescence of the FtsZ-labeled sample, the map of fluorescence of the ZapA-labeled sample, and the map of fluorescence of the ZapB labeled sample is shown. The cells are sorted according to their length in the maps (small cells on top and the longest cell on the bottom of the map). The number of analyzed cells is indicated and the percentage of cells with a cell length of more than 10 µm and the S.E.M. from a number (n) of experiments as indicated are shown. Brightness and contrast reflect the grey values within the map of fluorescence. EV is TB28∆zapA containing the plasmid pTHV037 [4] with the same resistance marker but without the ZapA gene. All mutants are shown in the supporting information Figure S4.

