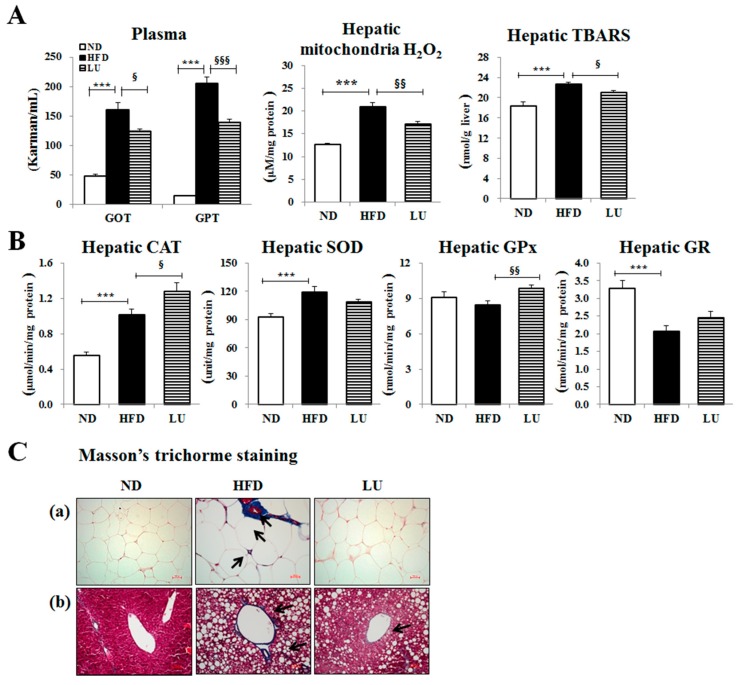
Figure 2.
Effect of luteolin treatment for 16 weeks on hepatic lipotoxicity markers and antioxidant enzyme activities, and Masson’s trichrome staining of hepatic and adipose tissues in C57BL/6J mice fed the high-fat diet. (A) Plasma levels of the hepatic lipotoxicity markers GOT and GPT and the levels of hepatic mitochondrial H2O2 and TBARS. (B) Activities of the hepatic antioxidant enzymes CAT, SOD, GPx, and GR. (C) Masson’s trichrome staining of transverse liver and epididymal sections (200× magnification). Data are shown as means ± SEM. ND vs HFD: * p < 0.05, ** p <0.01, *** p < 0.001. HFD vs LU: § p < 0.05, §§ p < 0.01, §§§ p < 0.001.

