Figure 3.
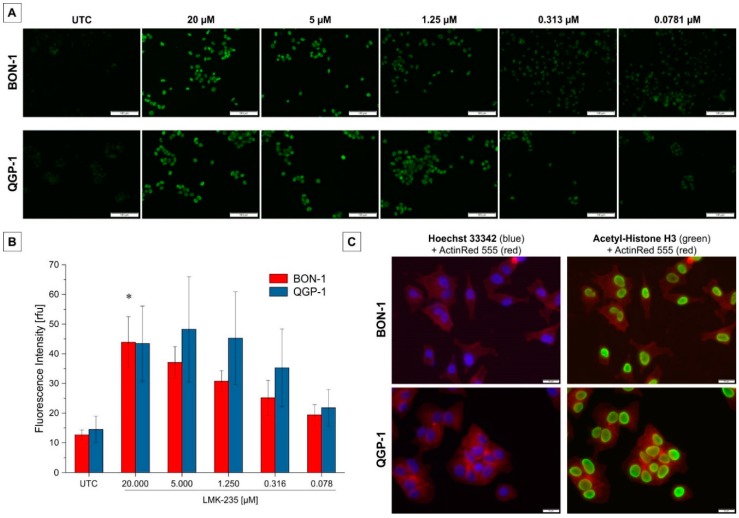
Acetyl-H3 immunofluorescence following LMK-235 treatment. (A) Results of one representative acetylated H3 immunofluorescence staining is shown for a LMK-235 dilution series for both cell lines. All samples were visualized using the same exposure time. Acetylated histone H3 is stained in green and the scale bar indicates 100 µm. Magnification 100×. (B) Quantitative immunofluorescence intensities are represented as bars for mean ± SEM. * indicate p < 0.05. (C) Overlay of ActinRed (red, cytoskeleton) with Hoechst 33342 (blue, nuclei) or acetyl-H3 (green) staining demonstrating the localization of acetyl-H3 staining exclusively in the cells’ nuclei. Magnification 200×. Abbreviations: UTC = untreated control.

