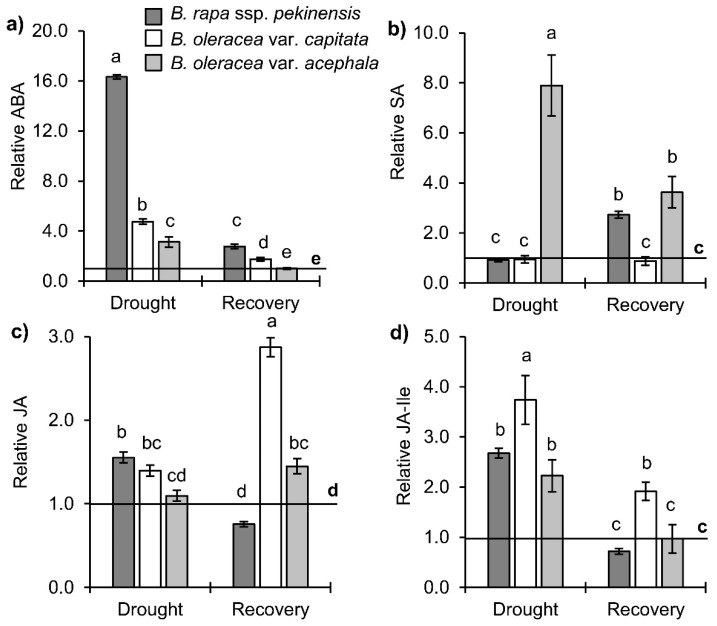
Figure 5.
Stress hormones profile in Brassica crops under drought and recovery: (a) ABA, (b) SA and jasmonates (c) JA and (d) JA-Ile. Controls are normalized to the value 1. Columns marked with different letters are statistically significantly different (p ≤ 0.05). Data are mean ± SD, n = 4. Raw data are presented in Supplementary Table S4.

