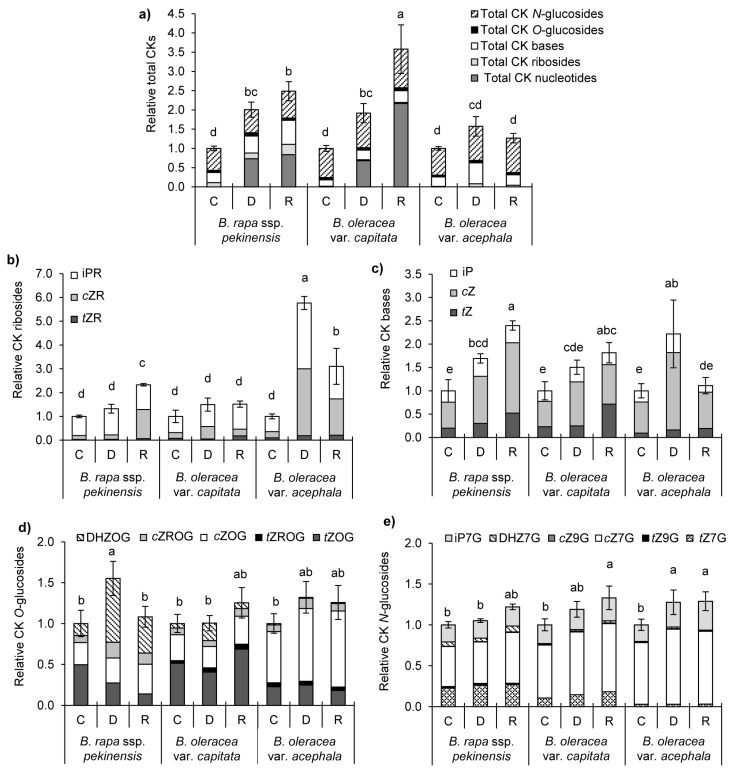
Figure 8.
Cytokinins profile in Brassica crops (B. rapa, B. oleracea var. capitata, and B. oleracea var. acephala) under drought (D) and recovery (R) in comparison to the corresponding controls (C); (a) Fluctuation of total cytokinins and distribution of individual CKs groups (nucleotides, ribosides, bases, O-glucosides, and N-glucosides); data are mean of 4 replicates; error bars present SD of total CKs. Fluctuations of CKs groups and individual types of CKs among group: (b) ribosides (R), (c), active bases (trans-zeatin, tZ; cis-zeatin, cZ; dihydrozeatin, DHZ; isopentenyladenine, iP), (d) O-glucosides (OG), and (e) N-glucosides (7G and 9G). Controls are normalized to the value 1. Columns marked with different letters are statistically significantly different (p ≤ 0.05). Data are means of 4 replicates; error bars present SD of total CKs groups. Raw data, normalized data and statistical analysis of individual CKs are given in Supplementary Tables S6–S9.

