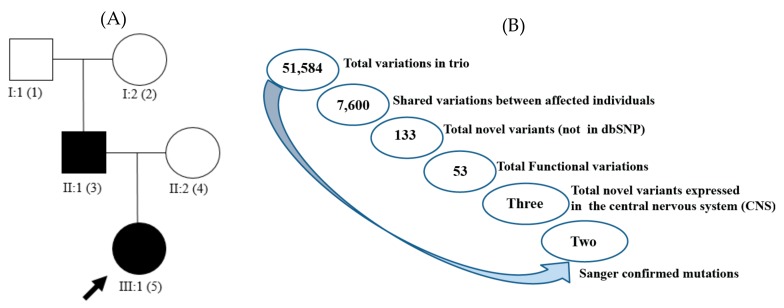
Figure 3.
(A) Family tree of two affected individuals with episodic ataxia. Squares represent men; circles, women; black filled figures, affected EA; unfilled figures, unaffected; arrow represents our proband; (B) schematic representation of the variant filtering. Total variant counts at each stage of filtering using Ion Reporter software resulted in two non-synonymous novel variants, in the affected individuals, of genes expressed in the central nervous system and confirmed with Sanger sequencing method.

