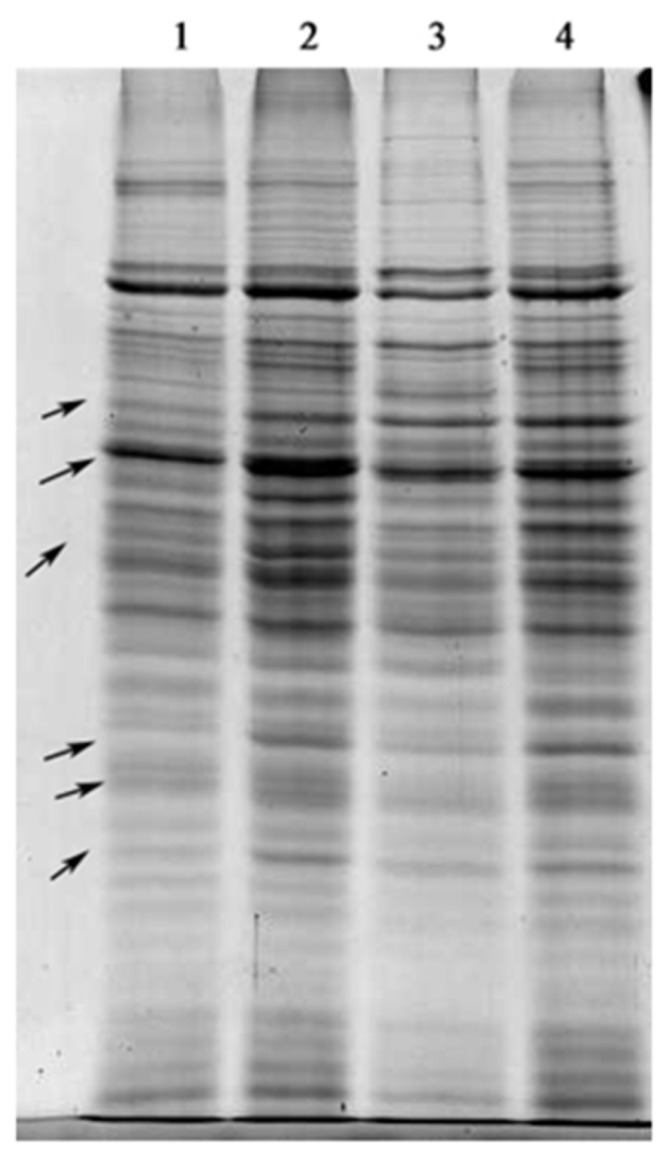
Figure 3.
Total proteins from mRET inhibitor-treated C. pyrenoidosa and the control. Lane 1, antimycin A treatment; lane 2, SHAM treatment; lane 3, NaN3 treatment; lane 4, control. Arrows: Representative bands in lanes 1–3 exhibiting significant difference with lane 4. The samples were loaded at the same protein concentration.

