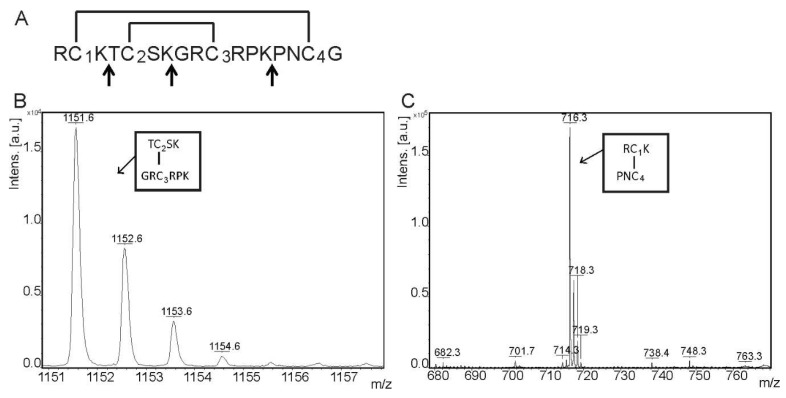
Figure 2.
Determination of AbeTx1 cysteine framework. (A) Amino acid sequence obtained by Edman degradation. Arrows indicate Endopeptidase LysC cleavage sites. Above the sequence, the disulfide bridge pattern is drawn. Cysteines are indicated by numbers (1–4) (B,C) MALDI–TOF mass spectra of the digested AbeTx1. Arrows highlight molecular weights and the corresponding fragments are shown. Monoisotopic molecular weights were compared with the calculated molecular weights.

