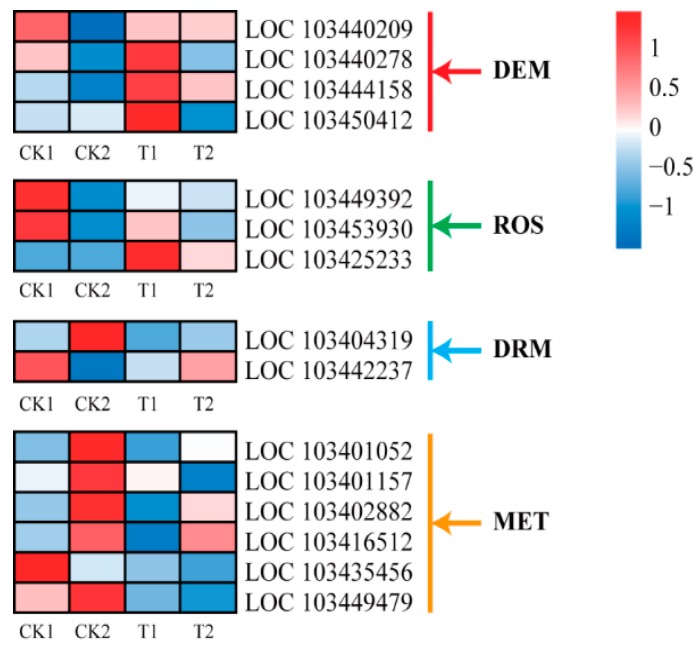
Figure 6.
Heat map representation of expression patterns of methylase genes in “Granny Smith” apple skins. DME, demethylase; ROS, repressor of gene silencing; DRM, DNA (cytosine-5)-methyltransferase; MET, methyltransferase. Columns and rows in the heat map represent samples collected at different time points for which bags were removed. The color scale on the right represents the log-transformed FPKM value.

