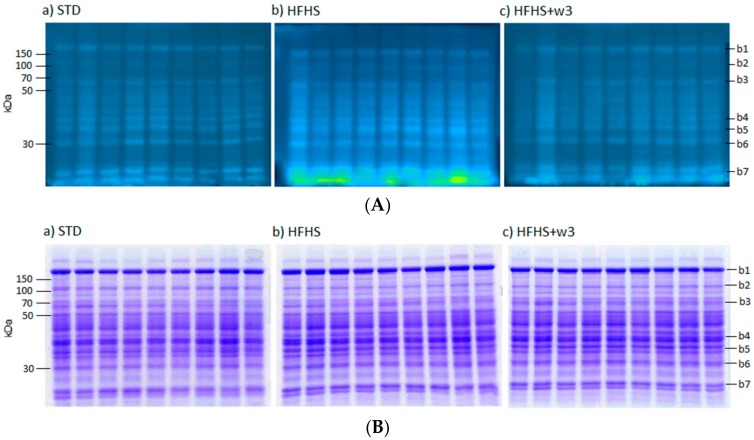
Figure 2.
(A) 1-D FTSC-stained gel of liver proteins. Dietary groups: (a) STD; (b) HFHS; and (c) HFHS + ω3. Marked bands (b1–b7) showed differential protein carbonylation index. (B) 1-D Coomassie-stained gel of liver proteins. Dietary groups: (a) STD; (b) HFHS; and (c) HFHS + ω3. Marked bands (b1–b7) showed differential protein carbonylation index.

