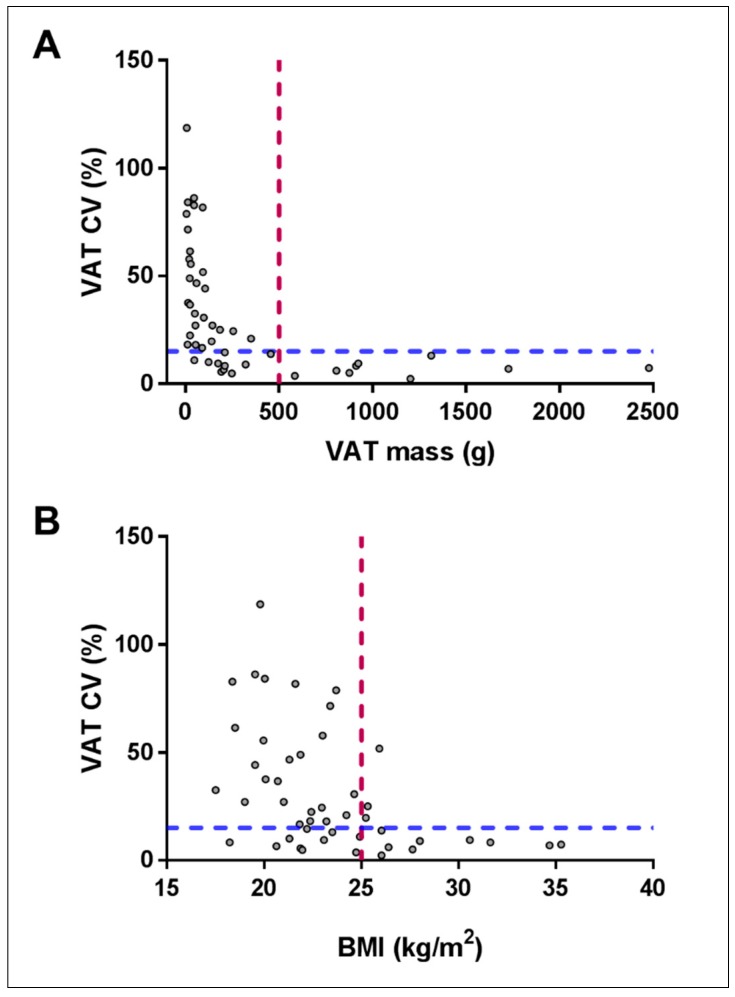
Figure 2.
Correlation scatterplot between visceral adipose tissue (VAT) mass coefficient of variation (CV%) and (A) VAT mass (g) rs = −0.795, p < 0.001; and (B) body mass index (BMI) (kg/m2) rs = −0.537, p < 0.001. The dashed lines represent the cut off lines for VAT (500 g) and BMI (25 kg/m2) to increase the probability of more reliable CV% for VAT assessments.

