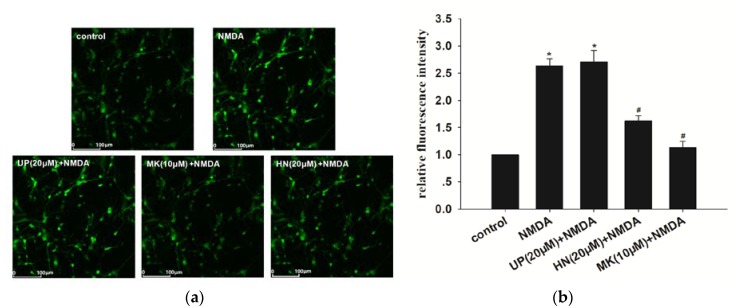
Figure 2.
HN suppressed intracellular calcium overload in NMDA-induced excitotoxicity. (a) Intracellular Ca2+ was measured via live cell imaging; (b) Represents bar diagram of relative fluorescence intensity. UP: unrelated peptide; MK: MK-801. Each value represents the mean ± S.E.M. of three independent experiments. * p < 0.05 vs. control group, # p < 0.05 vs. NMDA group.

