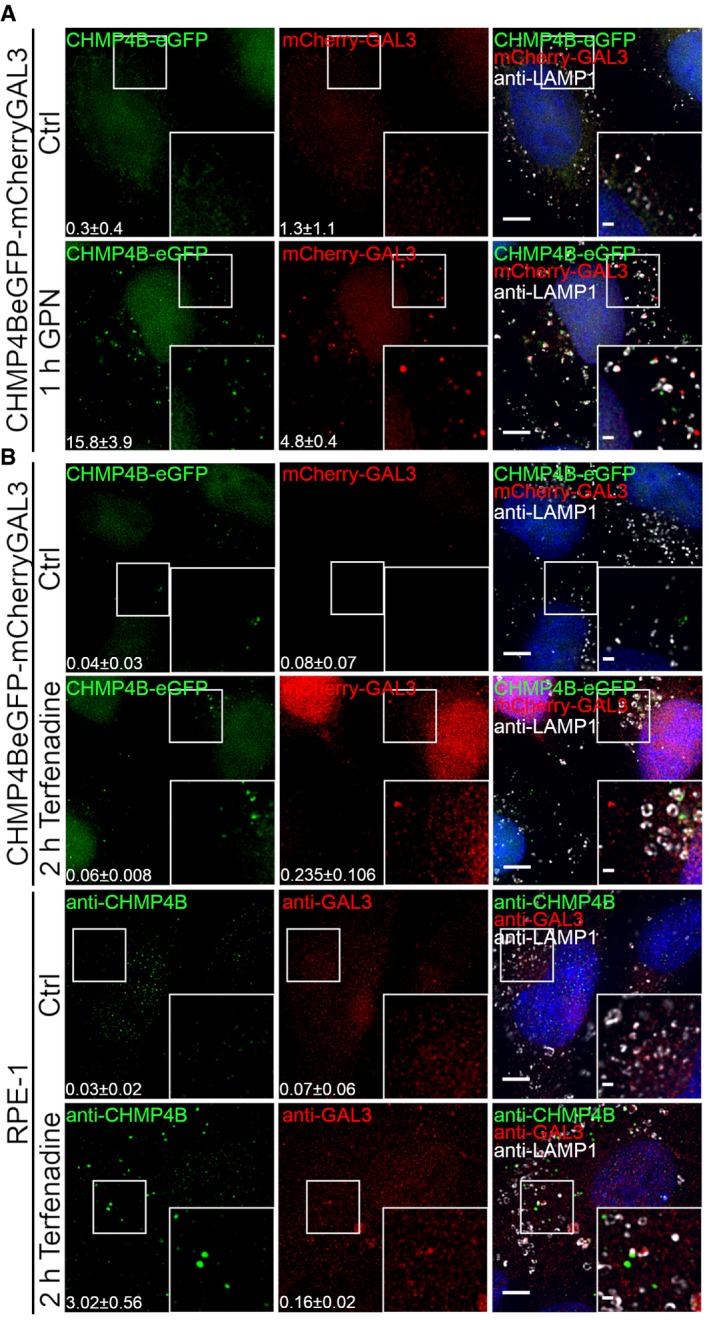
Representative fluorescence images showing recruitment of CHMP4B to damaged membranes in HeLa cells stably expressing CHMP4B‐eGFP and mCherry‐Galectin‐3 and RPE‐1 cells after 2‐h treatment with 7 μm cationic amphiphilic drug terfenadine. In HeLa cells, there is a slight but not significant increase in CHMP4B‐positive foci. On the other hand, RPE‐1 cells labeled with CHMP4B, GAL3, and LAMP1 antibodies have elevated number of CHMP4 and GAL3 foci per cell. For HeLa‐CHMP4BeGFP‐mCherry‐Galectin‐3: CHMP4B, GAL3 foci per cell (Ctrl versus terfenadine treatment): P = 0.2679, P = 0.2266 (Student's t‐test), respectively. For RPE‐1 cell line: CHMP4B, GAL3 foci per cell (Ctrl versus terfenadine treatment): P = 0.0169, P = 0.1806 (Student's t‐test), respectively. Number of foci per cell was quantified from >75 cells per condition from two independent experiments and is indicated in the figure as mean ± SD.