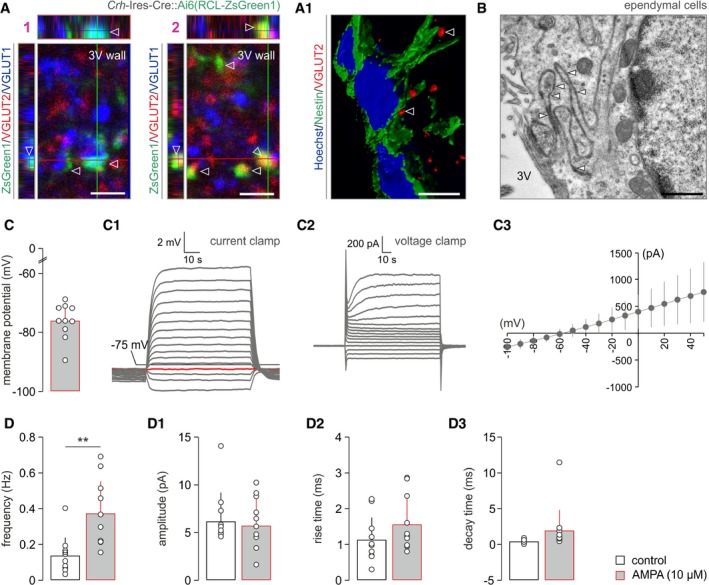
Figure EV1. Glutamatergic inputs to ependymal cells lining the 3rd ventricle (related to Fig 1).

- EGFP+ nerve endings from Crh‐Ires‐Cre::egfp mice along the wall of the 3rd ventricle (bottom edge of each image) contained either VGLUT2 (1) or VGLUT1 (2) immunoreactivities (open arrowheads). Orthogonal projections. (A1) Three‐dimensional rendering of VGLUT2+ nerve endings (open arrowheads) along nestin+ ependymal cells. Scale bars = 3 μm (1, 2) and 10 μm (A1).
- Electron micrographs showing gap junctions (arrowheads) between the convoluting plasmalemma of ependymal cells. Scale bars = 250 nm.
- Biophysical parameters of ependymal cell membranes, including resting membrane potential (C), and current‐clamp (C1) and voltage‐clamp (C2) profiles in response to 20 pA and 10 mV depolarization steps, respectively. I‐V relationship is shown in (C3). Data from n = 10 cells are shown.
- AMPA superfusion significantly increases the frequency of spontaneous postsynaptic currents in ventricular ependyma. **P < 0.01 (paired Student's t‐test), n = 10 cells/group. In the meantime, the amplitude (D1), rise time (D2), and decay time (D3) of such currents remained unchanged (for all parameters, P > 0.1).
