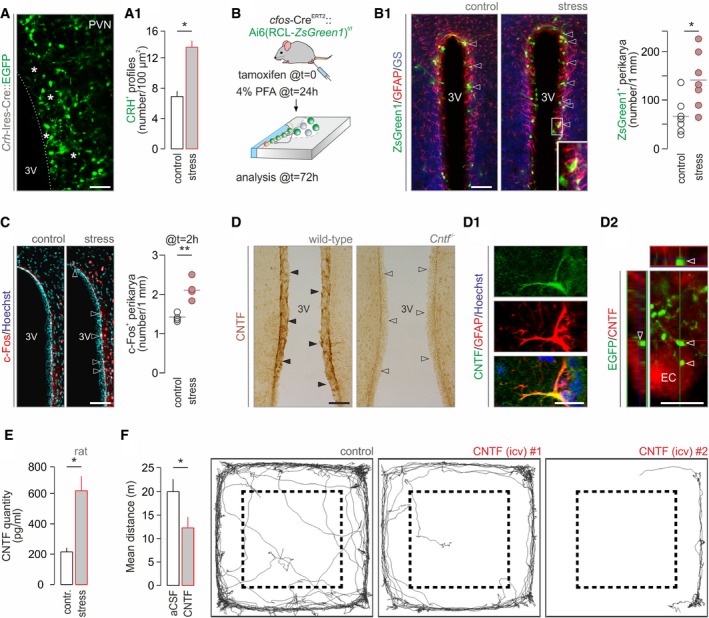
CRH terminals around ependymal cells (asterisks) of the 3rd ventricle marked by lifetime GFP labeling in Crh‐Ires‐Cre::egfp mice (n > 3 mice/group). Scale bar = 10 μm. (A1) The density of CRH+ boutons is increased upon acute stress. *P < 0.05.
Experimental design of activity “TRAP” experiments using coincidence detection in cfos‐CreERT2 mice. (B1) Left: Representative images of ZsGreen1
+ ependymal cells in the dorsolateral domain of the 3rd ventricle wall, closest to the PVN, after acute stress (arrowheads). Inset identifies GFAP+/glutamine synthetase (GS)+ ependyma. Scale bar = 150 μm. Right: Quantitative analysis collected within a 15‐μm‐broad band around the 3rd ventricle. *P < 0.05, n = 7 mice/group.
Quantitative histochemistry for c‐Fos 2 h after formalin stress. Left: Open arrowheads point to the increased density of c‐Fos+ ependymal lining the 3rd ventricle. n = 4 mice/group. Scale bar = 150 μm. Right: Quantitative data on ependymal cells directly exposed at the ventricular surface. **P < 0.01.
Ependymal cells express CNTF in wild‐type mice (solid arrowheads). Cntf
−/− mice were used to validate our histochemical results with their ependyma devoid of CNTF‐like immunoreactivity (open arrowheads). (D1) CNTF+ ependyma co‐express GFAP. Hoechst 33,342 was used as nuclear counterstain. (D2) EGFP+ nerve endings of EGFP‐expressing CRH neurons appose ependymal cells (EC; arrowheads) lining the 3rd ventricle. Orthogonal projection. Scale bars = 120 μm (D), 5 μm (D1), and 8 μm (D2).
CNTF concentration in the liquor filling the 4th ventricle is ˜threefold increased 20 min after acute noxious stress. n = 4 rats/group were used. *P < 0.05.
CNTF infusion (4 μl, 6 ng/μl) in the 3rd ventricle induces hypolocomotion. Dashed lines indicate the center–periphery boundary used. *P < 0.05, n = 7/group. Representative traces of ambulation over a period of 10 min are shown.
Data information: Data are expressed as means ± s.e.m. and were analyzed by either Student's
‐test (F).

