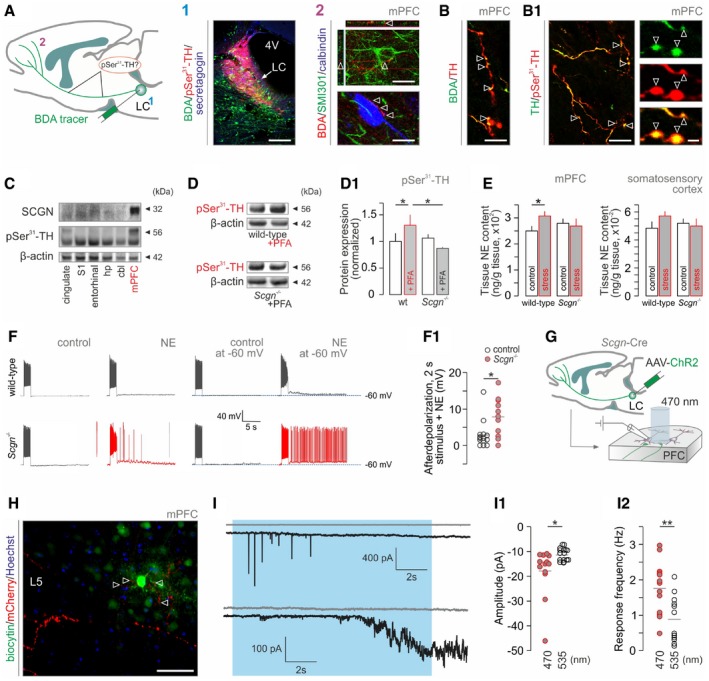
Schema of noradrenergic projections to the medial prefrontal cortex (mPFC) used for tract tracing and the analysis of axonal tyrosine hydroxylase (TH) phosphorylation. (1) Biotinylated dextran amine (BDA) injected into the mouse LC led to (2) BDA‐labeled TH+ axons contacting pyramidal cells (upper) and interneurons (lower) in the mPFC (open arrowheads). Scale bars = 100 μm (1) and 10 μm (2).
TH+ axons (open arrowheads, B) contained TH phosphorylated at Ser31 (open arrowheads, B1). Scale bars = 10 μm (B, B1/left) and 2 μm (B1/right).
Secretagogin (SCGN) is abundantly co‐expressed with Ser31‐phosphorylated TH in mPFC (note marginal expression in somatosensory cortex). cbl, cerebellum; hp, hippocampus; mPFC, medial prefrontal cortex; S1, primary somatosensory cortex.
Formalin stress induces TH phosphorylation in the mPFC of wild‐type but not Scgn
−/− mice; n = 5/genotype; *P < 0.05.
Scgn
−/− mice fail to produce NE in mPFC upon acute stress (
n ≥ 4/group). Figure
EV5H is referred to for data on unchanged dopamine and DOPAC levels. Note that acute formalin stress failed to significantly elevate NE in the somatosensory cortex (
P =
0.259) even if a differential response to stress between wild‐type and
Scgn
−/− mice is noticeable. *
P < 0.05.
NE superfusion ex vivo increases the excitability of layer (L) 5 pyramidal cells in the mPFC of Scgn
−/− mice relative to wild‐type littermates. (F1) Quantitative data. *P < 0.05, n ≥ 3 mice/genotype.
Experimental protocol to test whether optogenetic activation of NE efferents to the mPFC is sufficient to increase cortical network excitability. Fourteen days after AAV infusion, experiments were performed in acute brain slices spanning the mPFC using 470 and 535 nm (control) excitation wavelengths.
Biocytin‐filled L5 pyramidal neuron receives channelrhodopsin‐2/mCherry‐containing NE inputs. Open arrowheads point to varicosities apposing pyramidal dendrites. Scale bar = 100 μm.
Representative images of heightened glutamatergic responses in L5 pyramidal cells upon 470‐nm light excitation (blue shading). Gray traces (top) show the lack of excitability when exposed to light at 535 nm. (I1) Amplitude of postsynaptic currents at both wavelengths. *P < 0.05 vs. control at 535 nm. (I2) Light‐induced response frequencies. **P < 0.01 vs. control at 535 nm.
Data information: Data are expressed as means ± s.e.m. and were statistically tested by Student's
‐test (D1, E) or one‐way ANOVA (F1, I1, I2).