-
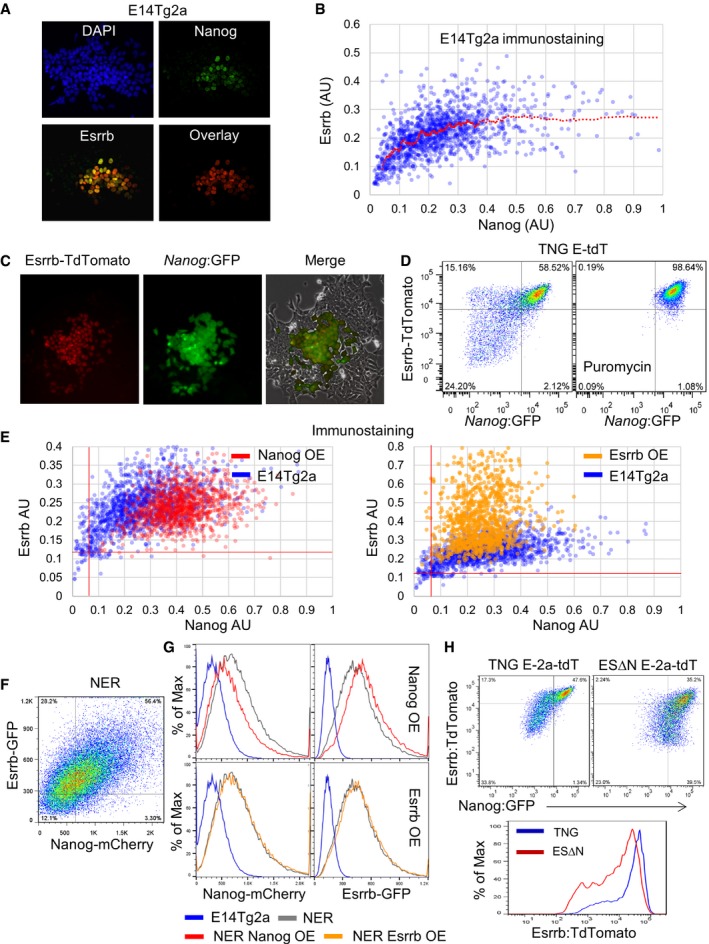
A, B
Immunofluorescent detection of NANOG and ESRRB protein in wild‐type E14Tg2a ESCs cultured for 3 days in LIF/FCS. (A) Widefield images of a representative colony. (B) Quantification of the mean NANOG and ESRRB fluorescence levels measured in nuclei identified by automatic segmentation of single optical plane images obtained by confocal microscopy. Values are expressed in arbitrary units (AU). OCT4negative cells, also identified by immunostaining, were excluded from the analysis. The red line represents the moving average of the data distribution. Representative of three independent experiments each including at least 1,000 nuclei.
-
C
Colonies of TNG E‐tdT ESCs showing GFP expression from Nanog and Esrrb‐tdTomato fusion protein expression from Esrrb after 3 days in LIF/FCS.
-
D
Flow cytometric analysis of Esrrb and Nanog fluorescent reporter expression in SSEA1+ TNG E‐tdT ESCs cultured for 3 days in LIF/FCS with or without puromycin.
-
E
Immunofluorescent detection and quantification (as in panel B) of total NANOG and ESRRB protein in E14Tg2a ESCs overexpressing NANOG (left) or ESRRB (right) cultured for 3 days in LIF/FCS. Parental E14Tg2as are shown as a reference. The red lines indicate the negative thresholds defined by staining ESCs differentiated for 3 days in the absence of LIF and the presence of retinoic acid.
-
F
Flow cytometric analysis of Esrrb‐GFP and Nanog‐mCherry fusion protein expression in SSEA1+ NER ESCs cultured for 3 days in LIF/FCS.
-
G
Histograms showing expression levels of Esrrb‐GFP and Nanog‐mCherry from the respective targeted endogenous alleles in SSEA1+ NER ESCs overexpressing NANOG (left) or ESRRB (right) cultured for 3 days in LIF/FCS. Parental NER ESCs are shown as a reference, and wild‐type E14Tg2a set the negative thresholds.
-
H
Comparative flow cytometric analysis of Esrrb‐2a‐tdTomato and Nanog:GFP expression in undifferentiated SSEA‐1+ TNG E‐2a‐tdT or Nanog‐null ESΔN E‐2a‐tdT ESCs cultured for 3 days in LIF/FCS. Data are shown as dot plots (top) and histogram (bottom).
Data information: For a schematic representation of the reporter allele configuration characteristic of each cell line, please refer to Fig
.