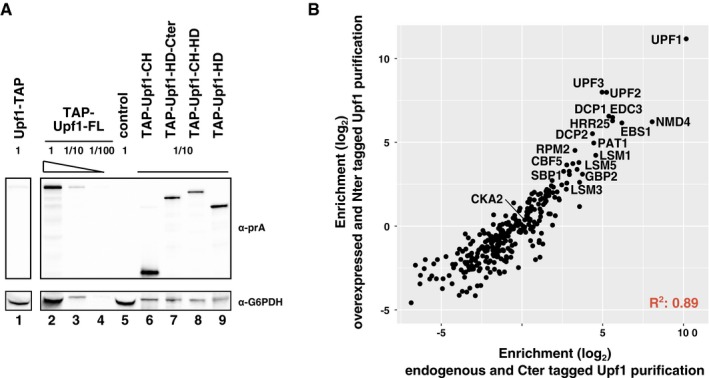
Figure EV2. N‐terminal and C‐terminal tagged Upf1 enrich similar sets of specific proteins.

- Estimation of the levels of overexpression for N‐terminal tagged Upf1 fragments, in comparison with chromosomally C‐terminal tagged protein. G6PDH was used as a loading control. Serial dilutions were used to test the ability of the immunoblot signal to estimate protein levels.
- Average enrichment values for purifications done with chromosomally C‐terminal tagged Upf1 (x‐axis) and N‐terminally TAP‐tagged Upf1.
