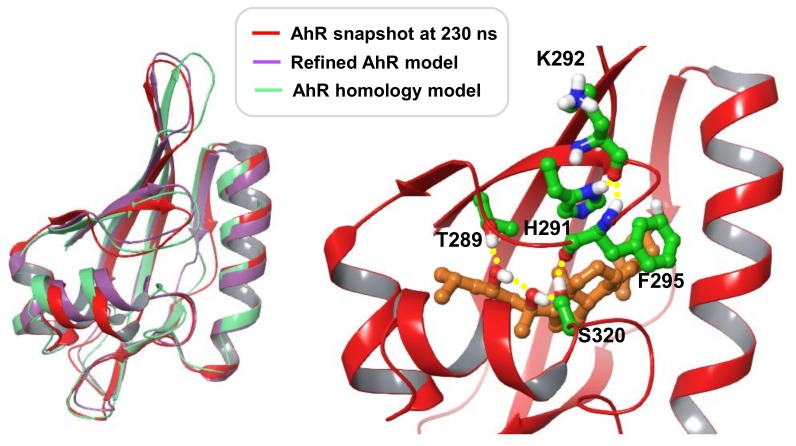
Figure 7.
Structural fold of AhR models. To the left: Superimposed are the initial homology model, the refined AhR model and a molecular dynamic simulation snapshot at 230 ns. To the right: Close-up view of the simulation snapshot at 230 ns, displaying the ligand and AhR residues involved in an interaction network, as discussed in the text. 20S,23S(OH)2D3 is shown with carbon atoms colored light brown, AhR residue carbons colored green; all other atoms are colored by atom type (O: red, N: blue, S: yellow). Hydrogen bonding interactions are indicated with yellow spheres.

