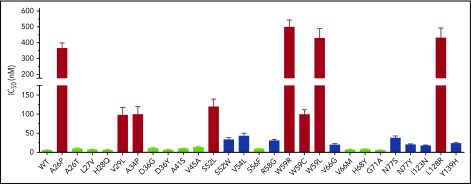
Figure 2.
Warfarin-resistance variation among naturally occurring VKOR mutations. Warfarin resistance was evaluated by the IC50. Each individual VKOR mutation was transiently expressed in DGKO FIXgla-PC/HEK293 reporter cells and IC50 was determined, as described in the Figure 1 legend. Green bars, IC50 increase < threefold; blue bars, IC50 increased between 3.4-fold to 8.5-fold; red bars, IC50 increase > 20-fold.

