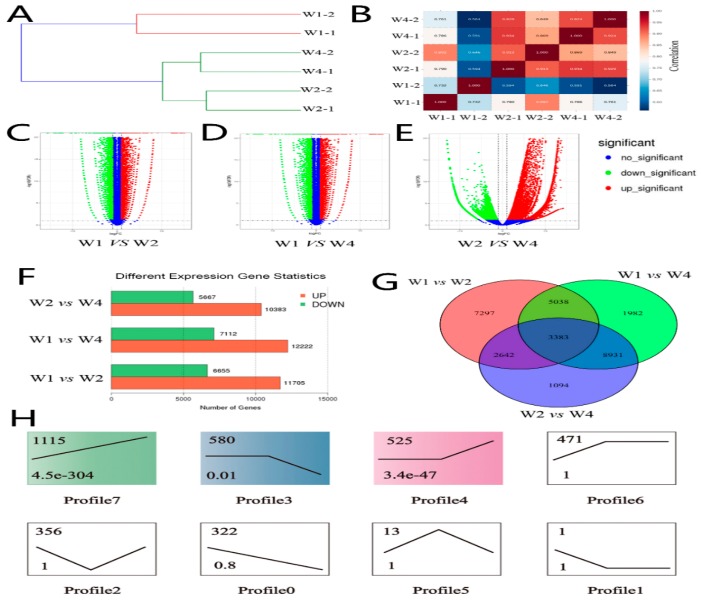
Figure 1.
Identifying differentially expressed genes by transcriptome sequencing. (A) The hierarchical clustering was carried out for intergroup analysis correlation. (B) Sample correlation heat-map was performed according to the expression profiles for quality control. (C–E) The volcano plot of significant differentially expressed genes (DEGs) in three groups (W1, W2, and W3). Blue represents no significant difference. Green represents significantly downregulated DEGs. Red represents significantly upregulated DEGs. A total of 16,050, 19,334, and 18,306 DEGs were identified with pairwise alignment in intergroup. (F) The statistical graph of significant intergroup DEGs. Green represents downregulated genes. Red represents upregulated genes. (G) Venn diagram of differentially expressed genes in three groups. (H) Profile analysis of 3383 DEGs by STEM.

