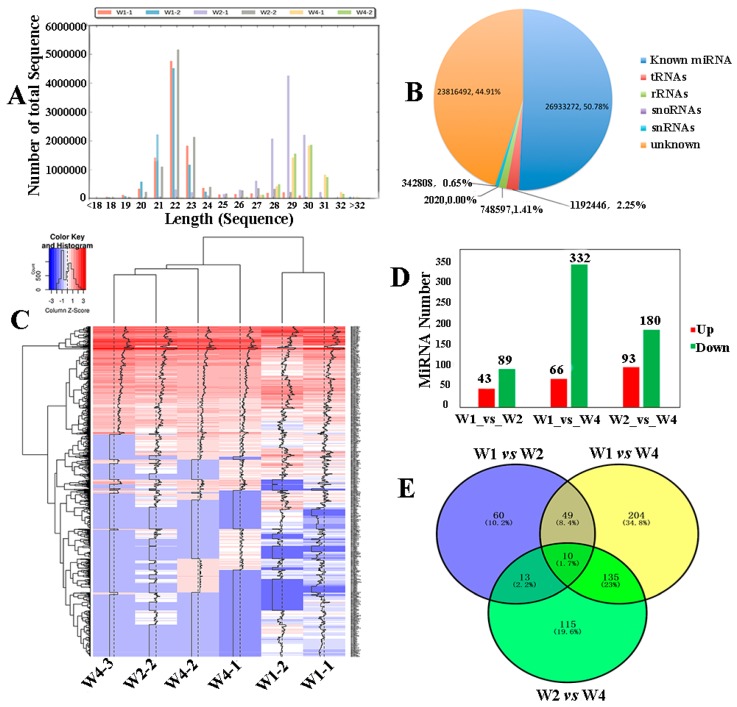
Figure 2.
Identifying differentially expressed microRNA of small RNA sequencing. (A) The fragment length distribution of microRNAs in Tianzhu white yak testis. (B) The percentage statistics of small RNA in all samples. (C) The heatmap of all microRNAs in the three groups. (D) The statistical graph of the differentially expressed miRNAs (DERs) between groups. (E) The Venn diagram was constructed based on the aforementioned DERs by multiple comparisons of the three groups.

