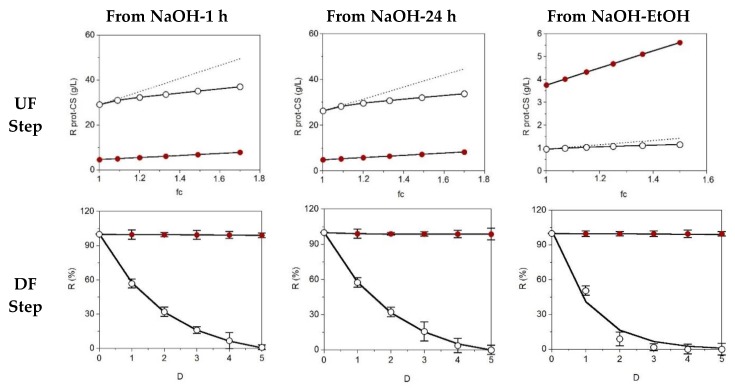
Figure 3.
Ultrafiltration (UF) and diafiltration (DF) progress for samples obtained from NaOH (1 h and 24 h of hydrolysis) and NaOH-EtOH treatment. Top: concentration of retained protein (ο) and CS (●) in linear relation with the factor of volumetric concentration (fc) depicting experimental data (points) and theoretical profiles corresponding to a fully-retained solute (discontinuous line). Bottom: progress of protein (ο) and CS (●) retention with the increase of diavolume from DF step (D). Error bars are the confidence intervals (α = 0.05; n = 2).

