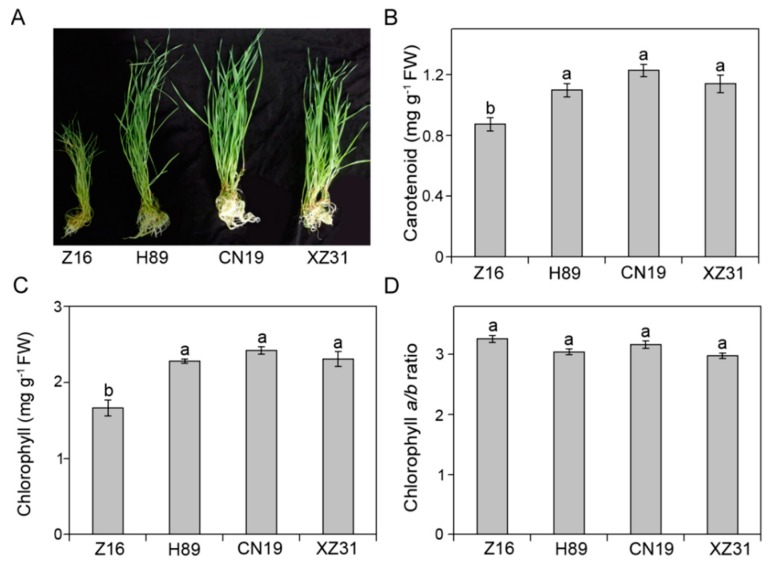
Figure 1.
Phenotype (A), carotenoid (B), chlorophyll content (C), and chlorophyll a/b ratio (D) in Z16, H89, CN19, and XZ31. Values are means ± SD from four independent biological replicates (n = 4). Different letters indicate significant differences among Z16, H89, CN19, and XZ31 (p < 0.05) following Duncan’s multiplication range test. Z16, H89, CN19, and XZ31 present accessions of Triticum monococcum (W2n), Triticum dicoccum (W4n), Triticum aestivum (W6n), and octaploid Triticale (T8n), respectively.

