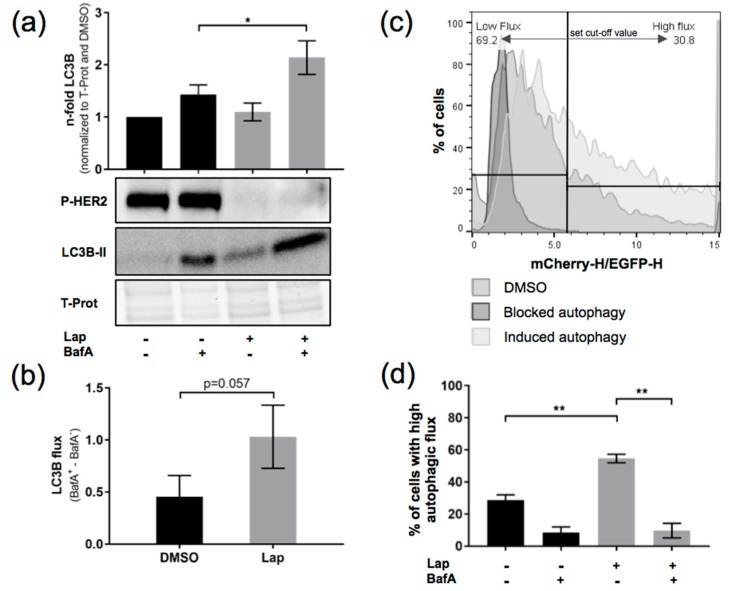
Figure 1.
Induction of autophagic flux in OE19 upon Lapatinib treatment. (a) LC3B flux was assessed comparing control and BafilomycinA (BafA)-treated (200 nM, 2 h) OE19 upon Lapatinib treatment (120 nM, 24 h). LC3 band intensities were quantified using ImageJ software. Total protein was used as a loading control, and Phospho-Her2 for Lapatinib treatment (n = 3). (b) LC3B flux was calculated from data in (a) as follows: BafA+-BafA− values for each condition. (c) FACS analysis of mCherry-EGFP-LC3B-expressing OE19 cells upon induction or blockade of autophagy with indication of the chosen cut-off value for high respectively low autophagic flux. (d) Quantification of the FACS analysis showing % of cells with high autophagic flux (n = 3). Cells were treated as in (a). The error bars represent SD, statistical significance was determined by Mann–Whitney U test: * p ≤ 0.05, ** p ≤ 0.01.

