Figure 3.
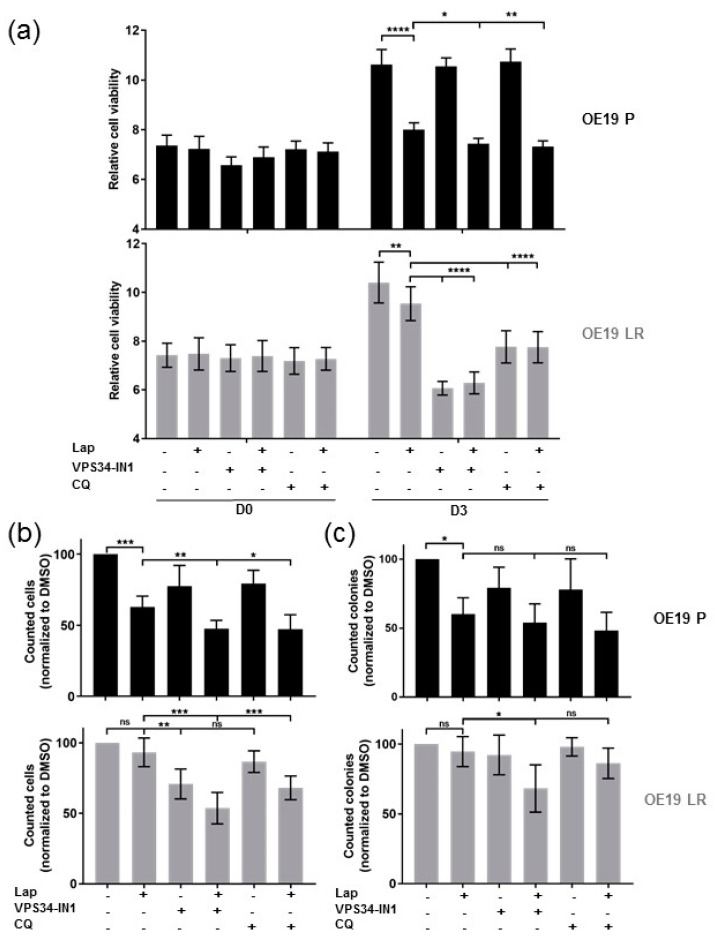
Combined Her2 and autophagy inhibitor treatment (a) Relative cell viability of OE19 cells treated with Lapatinib (120 nM) and/or autophagy inhibition either VPS34 inhibitor (VPS34-IN1) (5 µM) or chloroquine (CQ) (25 µM) at days 0 and 3 of the alamarBlue® experiment (n ≥ 3). (b) Cell counts of OE19 P and OE19 LR cells treated as in (a) but for 48 h. Values were normalized to DMSO control treated cells (n = 7) (c) Colony numbers after treatment as described in (b), reseeded (2500 cells/well) in six-well plates and incubation for 14 days without treatment (n = 5). The error bars represent SD, statistical significance was determined by Mann–Whitney U test: ns = non significant p > 0.05, * p ≤ 0.05, ** p ≤ 0.01, *** p ≤ 0.001, **** p ≤ 0.0001.

