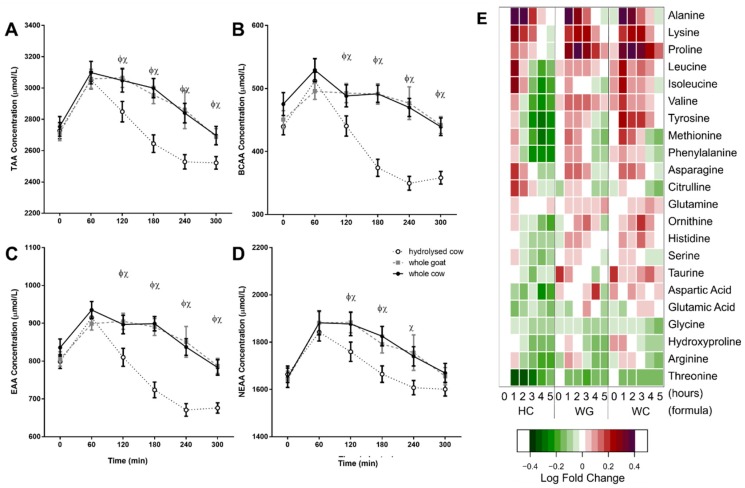
Figure 2.
Plasma amino acid responses following formula ingestion. (A) Total amino acids (TAA). (B) BCAA. (C) Essential amino acids (EAA). (D) Non-essential amino acids (NEAA), (E) Individual amino acid concentrations as fold changes. Values represent means ± SEM in μmol/L (A–D) for whole cow (WC; ●), hydrolysed cow (HC; ○), and whole goat (WG; ■) fortified milks and mean fold changes (E) relative to concentrations at HC fortified milk at baseline (‘0’). The x-axis shows time from baseline (‘0’) to 5 h (‘5’), for each formula (HC, WG, WC). White represents a 0 log fold change from hydrolysed cow fortified milk at baseline. Red represents a 1 log fold increase; purple represents a 2 log fold increase; green represents a 1 log decrease. There were time × treatment interactions for all amino acid groupings (TAA, BCAA, EAA, NEAA; p < 0.001 each, respectively; Sidak corrected post hoc tests). Φ denotes statistical significance p < 0.05 between WG and HC fortified milks; χ p < 0.05 between WC and HC fortified milks (Sidak corrected post hoc tests).

