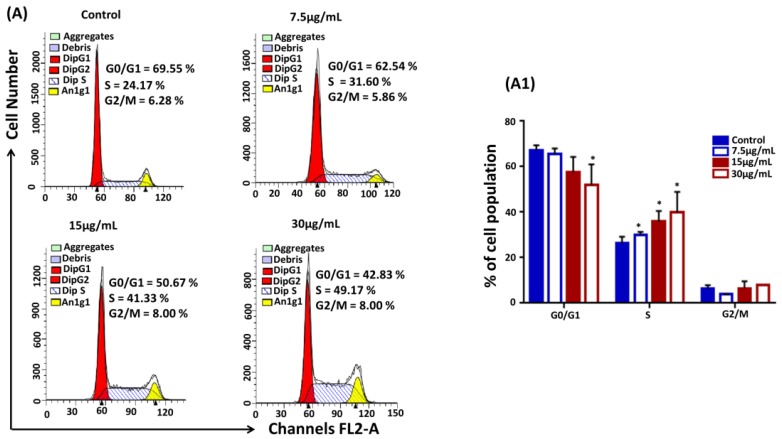
Figure 2.
LP1 arrested S phase of the cell cycle. (A) SGC-7901 cells treated with (0, 7.5, 15, 30 µg/mL) of LP1 for 48 h to analyze DNA content by using flow cytometer. Representative images indicating the distribution and percentage of cells in G0/G1, S and G2/M phase. (A1) The graph represents the distribution and percentage of cells within different phases of the cell cycle. Results are expressed as means ± SD of three independent experiments and (* p < 0.05).

