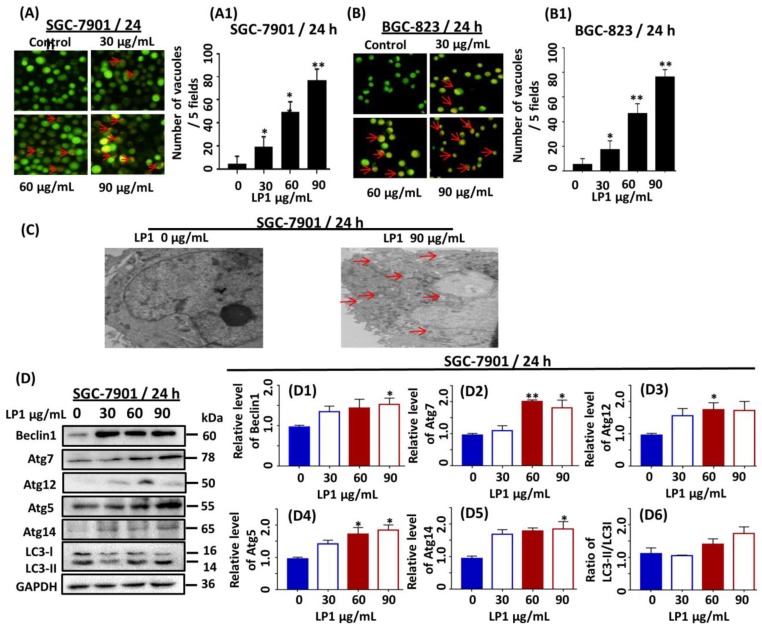
Figure 3.
Investigating the role of LP1 in the induction of autophagy by acridine orange staining (in SGC-7901 & BGC-823 cells), electron microscopy and western blotting in SGC-7901 cells. (A,B) Fluorescence microscope was used to take images of acidic vesicular organelles (AVOs), scale bar 100 µm was used for these images, SGC-7901/BGC-823 cells were treated with various concentration (0, 30, 60, 90 µg/mL) of LP1 for 24 h; before staining with acridine orange. (A1,B1) Numbers of vacuoles per cell were quantitated in five different fields. Results are expressed as means ± SD and (* p < 0.05, ** p < 0.01) of three independent experiments. (C) SGC-7901 cells were treated with and without LP1 for 24 h and electron microscopy was performed at 8000×; where red arrow indicating the autophagosomes. (D) The expression level of Beclin1, Atg7, Atg5, Atg12 Atg14 and LC3 in SGC-7901 cells treated with various concentration (0, 30, 60, 90 µg/mL) of LP1 for 24 h, analyzed by western blot assay. GAPDH was used as an internal control. (D1–D6) Western blots were quantified by densitometry, results are expressed as mean ± SD and (* p < 0.05, ** p < 0.01) of three independent experiments.

