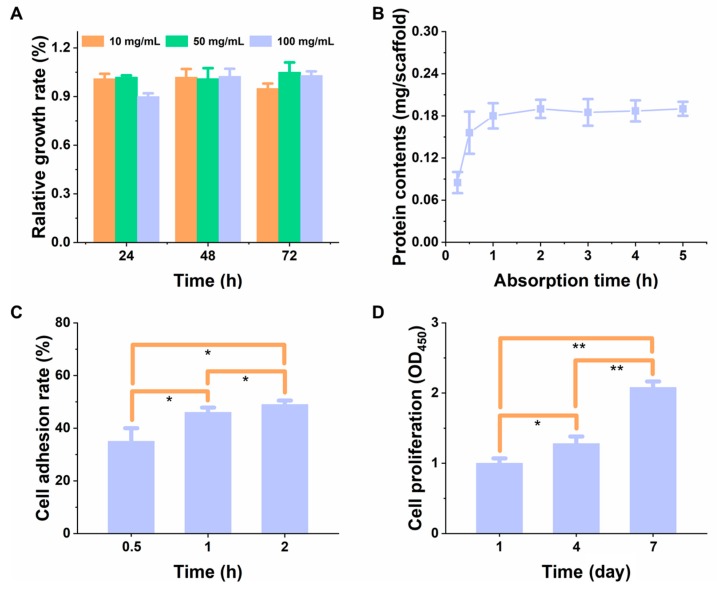
Figure 8.
(A) The relative growth rate of L929 cells on the PLGA scaffold. The concentrations of the scaffold leaching solution were 10, 50, and 100 mg/mL, respectively. (B) Protein adsorption efficacy onto the scaffold at different time intervals. (C) Cell adherence rate and (D) proliferation rate on the scaffold, at different time intervals, (n = 5). * represents p < 0.05, ** represents p < 0.01.

