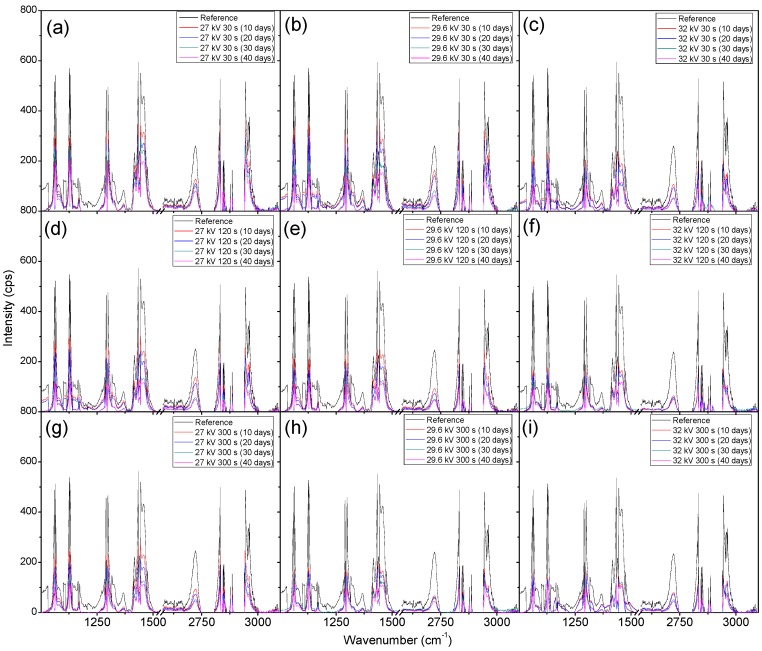
Figure 14.
Raman spectroscopy measurements of LDPE after their introduction into the bacterial broth to obtain biodegradation to determine the impact ≈4% CO2 had in the plasma discharge. (a–i) show how exposure time and applied voltage during plasma treatment impact the degradation process of LDPE. (a–c), (d–f), and (g–i) show how the changes in voltage impact the degradation of LDPE while maintaining a constant treatment time. (a,d,g), (b,e,h), and (c,f,i) show how the changes in treatment time impact the degradation of LDPE while maintaining a constant applied voltage.

