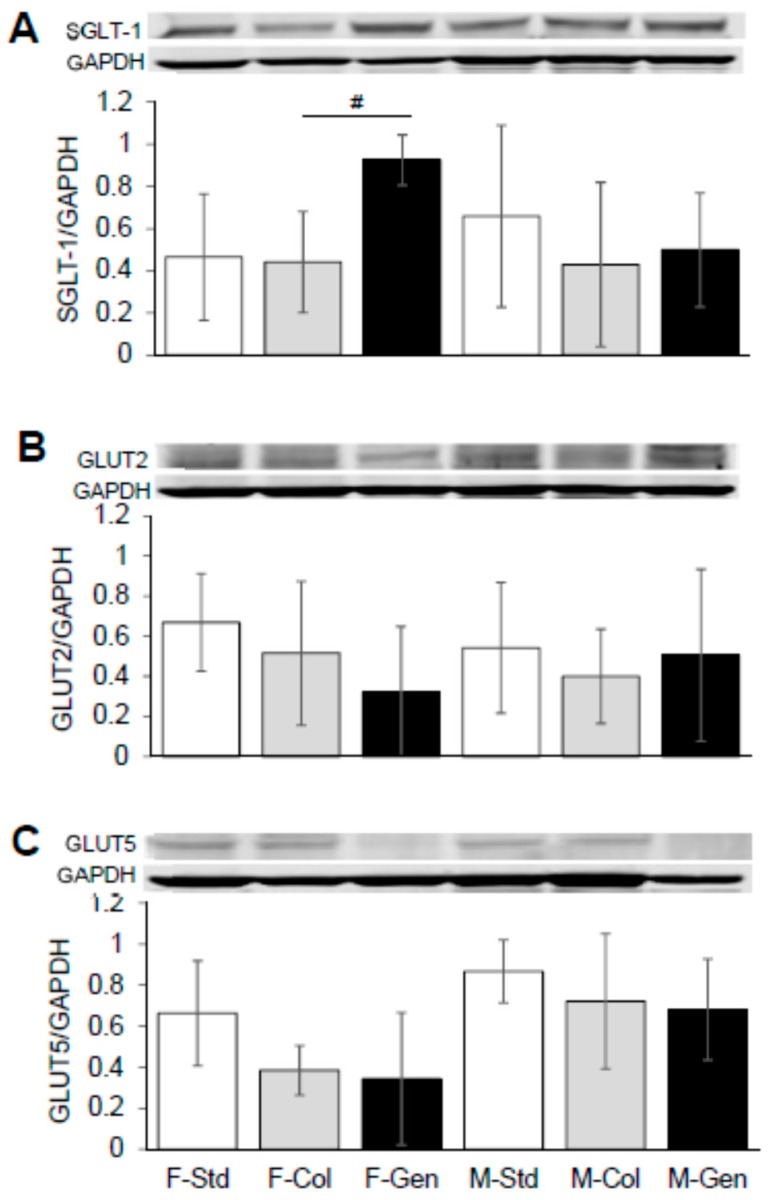
Figure 4.
Effect of dietary genistein on total expression of SGLT-1, GLUT2 and GLUT5 in jejunum of ΔF508-CF mice. (A) Typical western blot demonstrating SGLT-1 expression (normalized to GAPDH) in jejunum from CF mice. Average SGLT-1/GAPDH ratio is shown comparing regular standard diet, standard diet plus colyte and genistein diet. n = 4–7/group. (B) Typical western blot demonstrating GLUT2 expression (normalized to GAPDH) in jejunum from CF mice. Average GLUT2/GAPDH ratio is shown comparing regular standard diet, standard diet plus colyte and genistein diet. n = 4–8/group. (C) Typical western blot demonstrating GLUT5 expression (normalized to GAPDH) in jejunum from CF mice. Average GLUT5/GAPDH ratio is shown comparing regular standard diet, standard diet plus colyte and genistein diet. n = 4–8/group. Note: Std = standard diet, Col = colyte treated, and Gen = genistein diet. Values are means ± SD. # denotes statistical genistein-mediated effect, p < 0.05.

