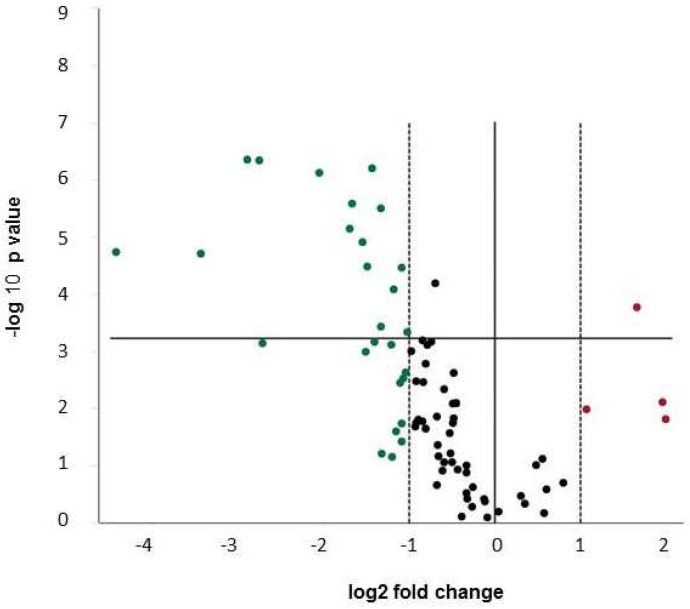
Figure 3.
Volcano Plot for changes of gene expression in MG63 cells after 24 h incubation with CoCl2 vs. unstimulated control. Expression data are normalized vs. glyceraldehyde 3-phosphate dehydrogenase (GAPDH). The statistical significance is plotted versus fold-change on the y- and x-axes, respectively. The horizontal line represents the significance level (p = 0.0006). Up-regulated genes are depicted in red, down-regulated genes in green and genes regulated by less than factor 2 in black. Low abundant transcripts are included. Data are summarized from four independent experiments.

