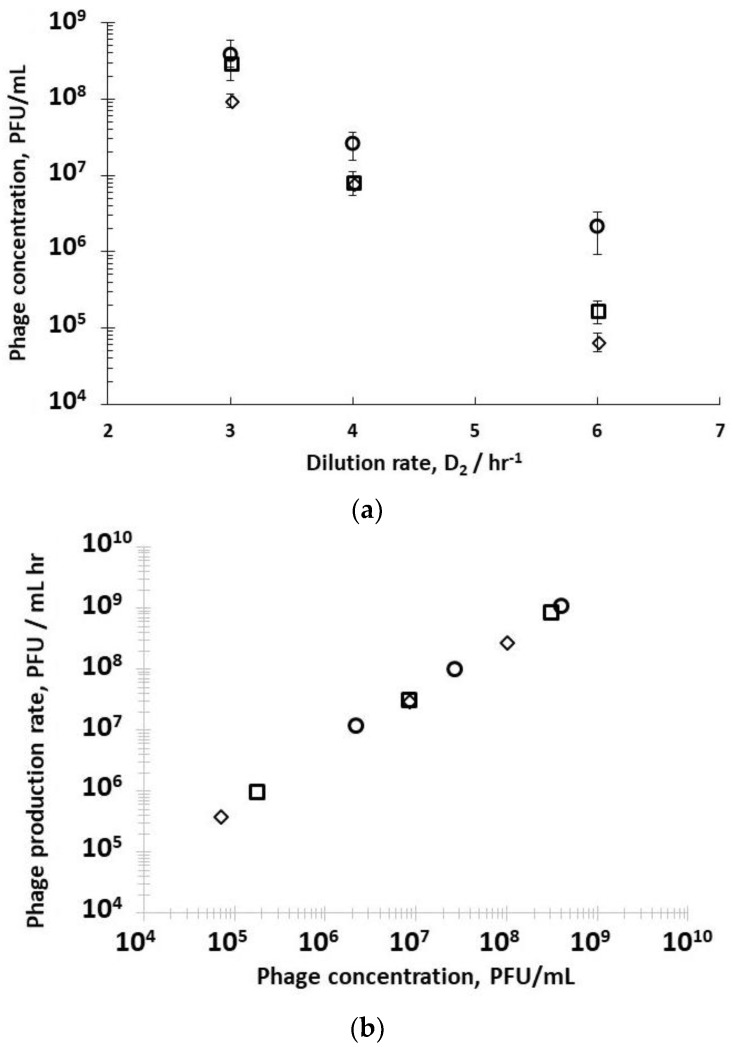
Figure 4.
(a) The effect of bacteria physiology and dilution rate D2 on phage titres in the second reactor R2. (b) Phage production rate as a function of phage concentration in R2. Open squares (□) correspond to phages produced in R2 when R1 was operated at D1= 0.4 hr−1; open round circles (o) correspond to phages produced in R2 when R1 was operated at D1= 0.5 hr−1; open diamonds (◊) correspond to phages produced in R2 when R1 was operated at D1= 0.6 hr−1. Error bars represent one standard deviation.

