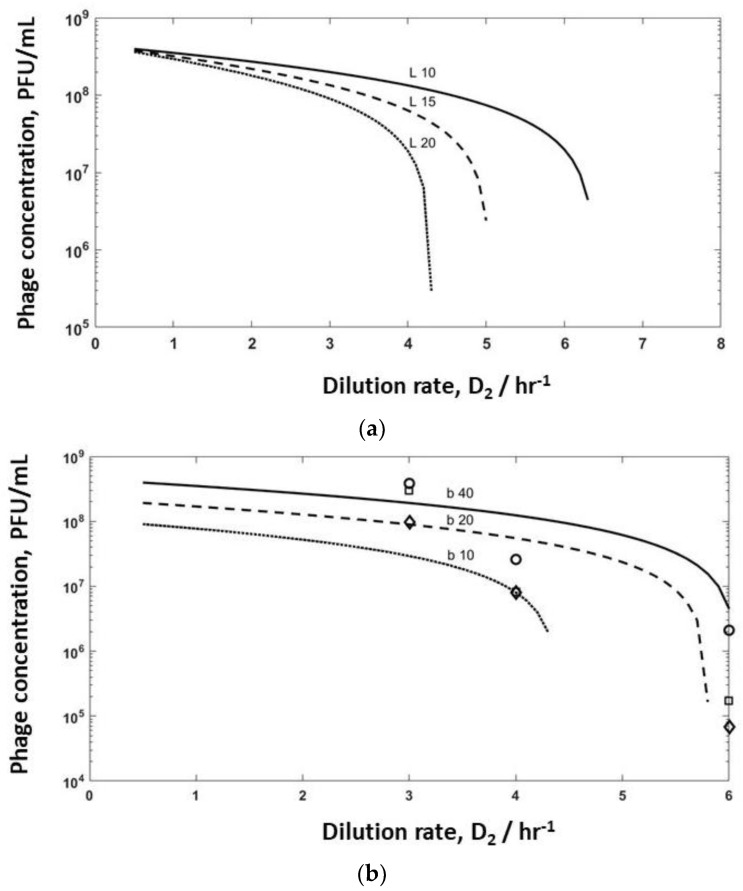
Figure 6.
Simulation results showing the effect of (a) lag time on phage washout; a burst size of 40 and adsorption rate of 3.6 × 10⁻¹¹ L hr−1 was used for the simulations; (b) burst size on phage titres and washout of phages in reactor R2: the dotted line represents the results of the numerical simulations using adsorption rates of 9 × 10⁻¹¹ L hr−1 and a burst size of 10, the dashed line represents the results of the numerical simulations using adsorption rates of 7 × 10⁻¹¹ L hr−1 and a burst size of 20, the solid line represents the results of the numerical simulations using adsorption rates of 3.6 × 10⁻¹¹ L hr−1 and a burst size of 40. Open squares (□) correspond to phages produced in R2 with R1 operated at D1= 0.4 hr−1; open round circles (o) correspond to phages produced in R2 with R1 operated at D1= 0.5 hr−1; open diamonds (◊) correspond to phages produced in R2 with R1 operated at D1= 0.6 hr−1. The other simulation parameters that were used for all of the simulations were: C1 = 1.1 × 10¹⁰ CFU L−1, S1 = 1.5 g L−1 and a lag time of 10 min.

