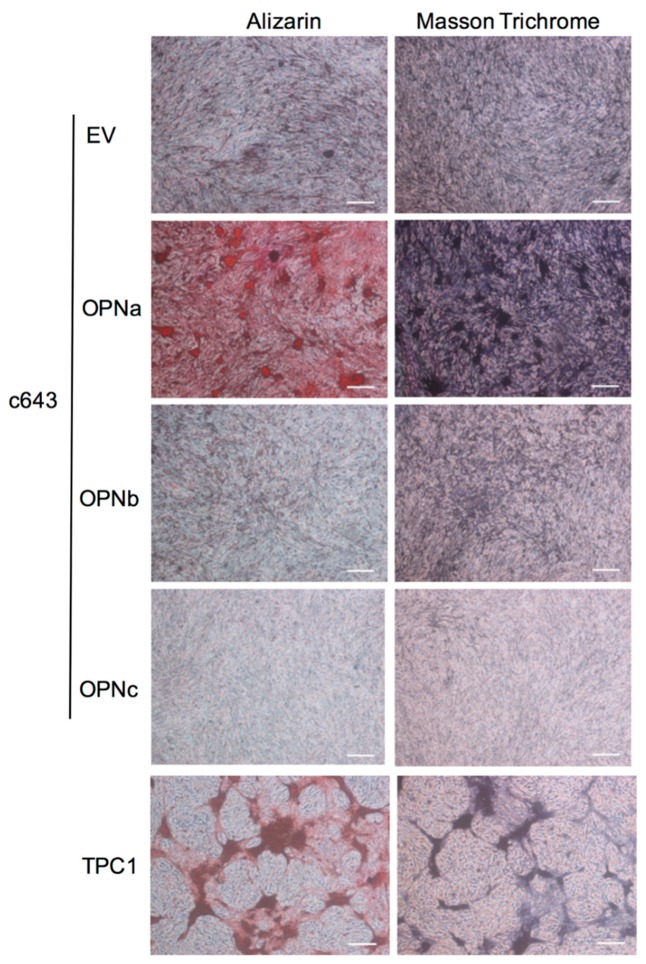
Figure 2.
Calcification and collagen production in c643 cell clones and TPC-1 cell line. Left panel: c643 cell clones overexpressing OPNa, OPNb, or OPNc, as well empty (EV) controls were analyzed (Left panel) for matrix calcification by Alizarin Red staining, in which darker orange areas represent extracellular matrix (ECM) areas rich in calcium deposits. Right panel: c643 cell clones and TPC-1 cells were analyzed for collagen deposits by Masson trichrome staining. Dark purple areas correspond to extracellular matrix rich in collagen. Scale bar: 100 µM. Representative photomicrographs of two independent experiments at 24 days of cell culture are shown.

