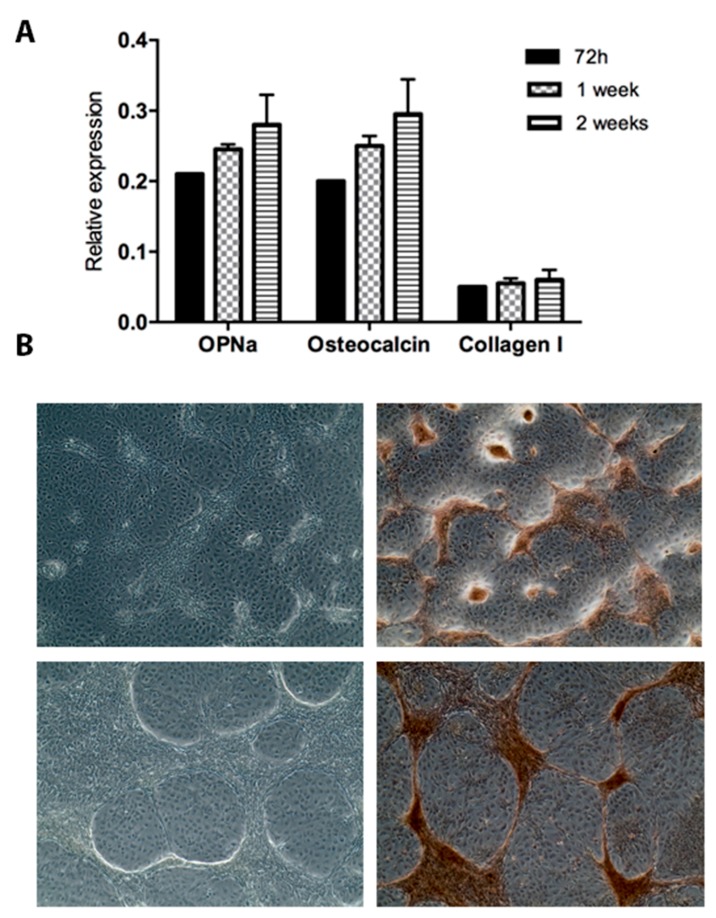
Figure 3.
OPNa, osteocalcin, and collagen type I transcript levels and calcification deposits in TPC-1 cell line. (A) OPNa, osteocalcin, and collagen type I messenger RNA (mRNA) expression levels was measured by RT-qPCR in the TPC-1 thyroid cell line after 72 h, 1 week, and 2 weeks of cell culture. (B) Representative phase contrast images for 72 h (upper panel) and 1 week (lower panel) of cell culture of TPC-1 cell line are shown in the left column. In the right column, matrix calcification was detected with Alizarin Red staining after 72 h and 1 week of cell culture. Dark brown areas correspond to ECM rich in calcium deposits.

