Figure 2.
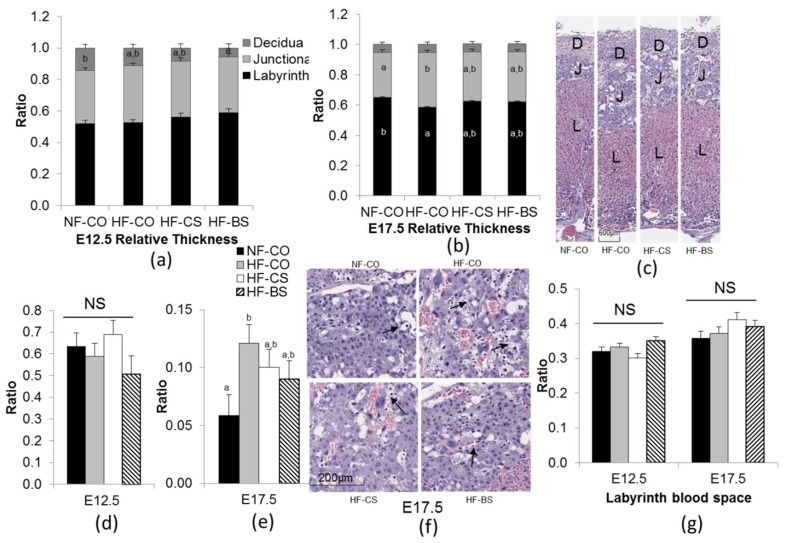
Placental histology at E12.5 and E17.5. (a,b) Relative thickness of placental layers. (c) Histological appearance of representative placentas at E17.5. (d,e) Glycogen cell area in the junctional zone. Results are presented as glycogen cell area/total junctional zone area. (f) Histological images demonstrate representative junctional zones with glycogen cells (arrowheads) at E17.5. (g) Labyrinth blood space. Results are presented as labyrinth blood space/total labyrinth layer area. Each group contained 5 dams. Different diets were fed to dams from 4 weeks before timed-mating to gestational day 12.5 or E17.5. Placentas from one male and one female embryo in each dam were included in the analysis. Values are mean ± standard error of mean (SEM); a, b: any two groups with no overlapping characters have a statistically significant difference (p < 0.05) between them. D, decidua; J, junctional zone; L, labyrinth zone; NF: normal-fat diet; HF: high-fat diet; BS: betaine supplemented; CO: untreated control; CS: choline supplemented; NS: not significant.

