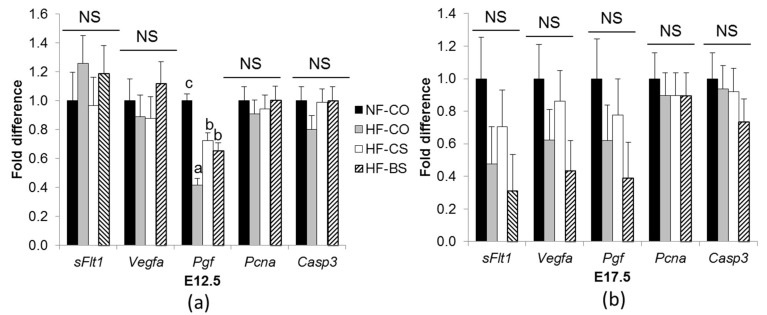
Figure 3.
mRNA abundance of angiogenic genes in the placenta at E12.5 (a) and E17.5 (b). Different diets were fed to dams from 4 weeks before timed-mating to gestational day 12.5 or 17.5. mRNA abundance was measured by real-time PCR. Each group contained 5 dams. Different diets were fed to dams from 4 weeks before timed-mating to gestational day 12.5 or E17.5. Placentas from one male and one female embryo in each dam were included in the analysis. Values are mean ± standard error of mean (SEM); a, b, c: any two groups with different characters have a statistically significant difference (p < 0.05) between them. Solid bars: NF-CO; shaded bars: HF-CO; open bars: HF-CS; hatched bars: HF-BS. Casp3: caspase 3; Pcna: proliferating cell nuclear antigen; Pgf: placental growth factor; sFLT1: soluble fms-like tyrosine kinase 1; Vegfa: vascular growth factor A. NF: normal-fat diet; HF: high-fat diet; BS: betaine supplemented; CO: untreated control; CS: choline supplemented; NS: not significant.

