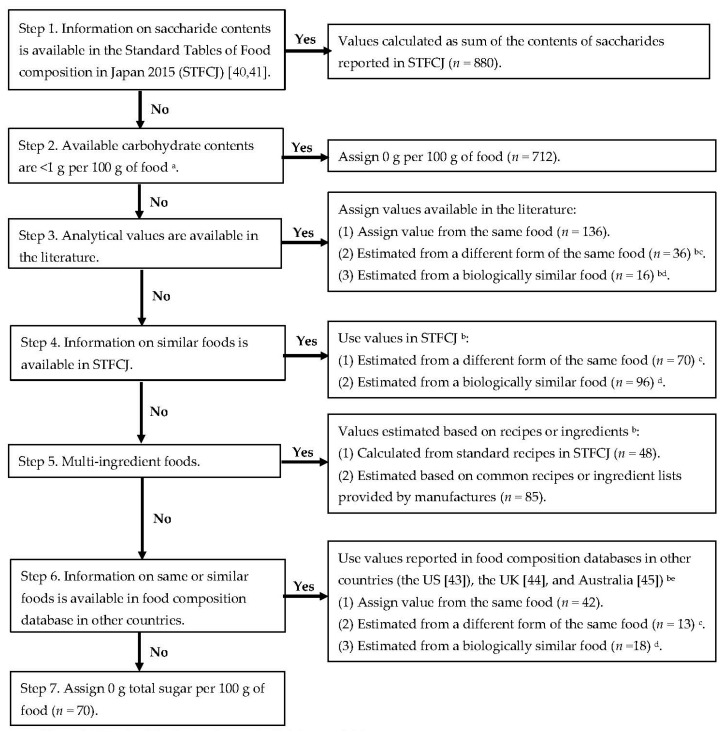
Figure 1.
Flow chart for the development of total sugar database. a Available carbohydrate content was calculated as subtracting dietary fiber content (g/100 g of food) from carbohydrate that was calculated as subtracting the sum of contents (g/100 g of food) of water, protein, lipid and ash from 100 g of food in the Standard Tables of Food composition in Japan 2015 [40,41]. b Values were adjusted using the ratio of the dry weight between interested and referred food items. c This was applied to items such as cooked (i.e., boiled, salted, or dried) vegetables and seaweeds using the value of raw form. Total sugar content of the different form was calculated as follows: total sugar content of cooked food = total sugar content of raw food × dry weight of cooked food/dry weight of raw food (a unit of all values was g/100 g of food). d Estimation was performed in mainly cereals, vegetables, fruits and seaweeds belonging to same family or order. Values from a similar food item were calculated after comparing total energy and other nutrient contents as follows: total sugar content of food of interest = total sugar content of similar food × dry weight of interest food/ dry weight of similar food (a unit of all values was g/100 g of food). e When the value of a specific food item was available in several countries, the source of imports was considered primary and a similarity for total energy and other nutrient contents was a second consideration. When assigning data from the UK, disaccharide values were multiplied by 0.95 since values were shown as monosaccharide equivalents [44].

