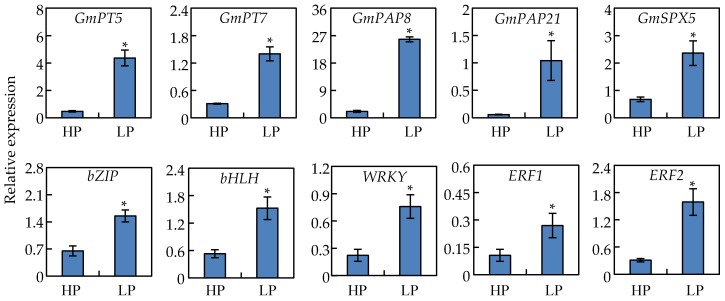
Figure 6.
qRT-PCR analysis of ten Pi responsive genes in soybean nodules under Pi sufficient (HP) and deficient (LP) conditions. Data in the figure are mean of four replicates with standard error. Asterisks indicate significant difference between HP and LP treatments in the Student’s t-test (*: p < 0.05).

