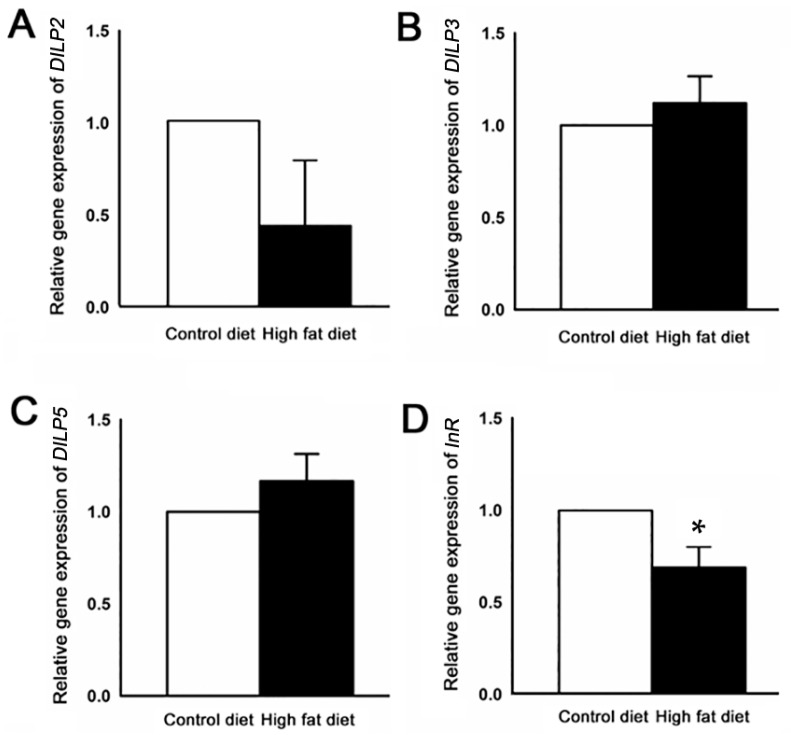
Figure 6.
Gene expression levels of some target genes related to insulin signaling identified by DEG analysis. (A) Relative DILP2 mRNA transcript levels after different food treatments for 14 days. (B) Relative DILP3 and (C) DILP5 mRNA transcript levels after different food treatments for 14 days. Both of the gene expressions were increased by approximately 10% in high fat diet (HFD)-fed flies as compared with control flies. (D) Relative InR mRNA transcript levels after different food treatments for 14 days. InR gene expression level was significantly decreased by approximately 30% compared with control flies. All qRT-PCRs were carried out in triplicate (* p < 0.05). Error bars represent SEM.

