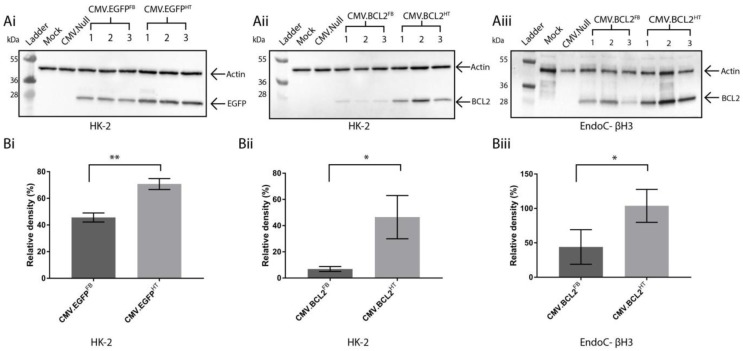
Figure 3.
(A) immunoblot analysis of cell lysates following transduction with the named BacMam vector in HK-2 (Ai,Aii) or EndoC-βH3 (Aiii) cells at 72 hpt using anti-EGFP or anti-BCL2 antibodies. Molecular weight markers are in kDa. (B) A bar graph was constructed using GraphPad Prism to show the relative band intensities for (Bi) EGFP in HK-2, (Bii) BCL2 in HK-2 and (Biii) BCL2 in EndoC-βH3 cells obtained by band densitometry. Each sample was normalised against a β-actin loading control. Error bars represent ± SD (n = 3) and indicate a significant difference between CMV.EGFPFB and CMV.EGFPHT, or CMV.BCL2FB and CMV.BCL2HT transduced cells using a Student’s t-test (p < 0.05).

